2.8. Grafana dashboard
2.8.1. Abstract
This chapter describes the Yardstick grafana dashboard. The Yardstick grafana dashboard can be found here: http://testresults.opnfv.org/grafana/
2.8.2. Public access
Yardstick provids a public account for accessing to the dashboard. The username and password are both set to ‘opnfv’.
2.8.3. Testcase dashboard
For each test case, there is a dedicated dashboard. Shown here is the dashboard of TC002.
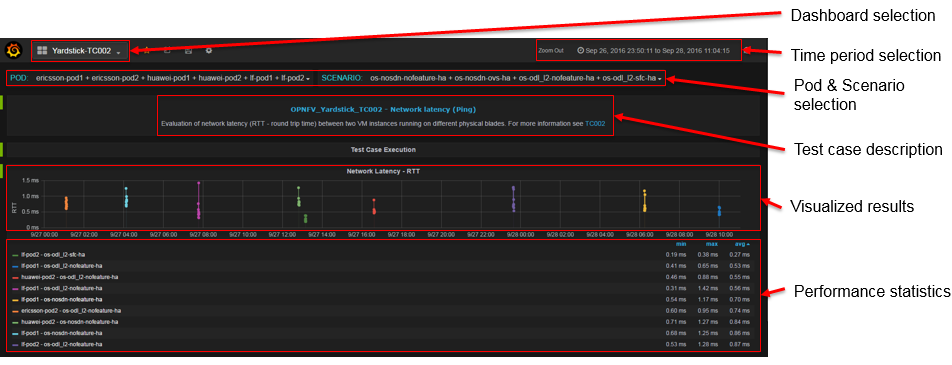
For each test case dashboard. On the top left, we have a dashboard selection, you can switch to different test cases using this pull-down menu.
Underneath, we have a pod and scenario selection. All the pods and scenarios that have ever published test data to the InfluxDB will be shown here.
You can check multiple pods or scenarios.
For each test case, we have a short description and a link to detailed test case information in Yardstick user guide.
Underneath, it is the result presentation section. You can use the time period selection on the top right corner to zoom in or zoom out the chart.
2.8.4. Administration access
For a user with administration rights it is easy to update and save any dashboard configuration. Saved updates immediately take effect and become live. This may cause issues like:
- Changes and updates made to the live configuration in Grafana can compromise existing Grafana content in an unwanted, unpredicted or incompatible way. Grafana as such is not version controlled, there exists one single Grafana configuration per dashboard.
- There is a risk several people can disturb each other when doing updates to the same Grafana dashboard at the same time.
Any change made by administrator should be careful.
2.8.5. Add a dashboard into Yardstick Grafana
Due to security concern, users that using the public opnfv account are not able to edit the yardstick grafana directly. It takes a few more steps for a non-yardstick user to add a custom dashboard into yardstick grafana.
There are 6 steps to go.
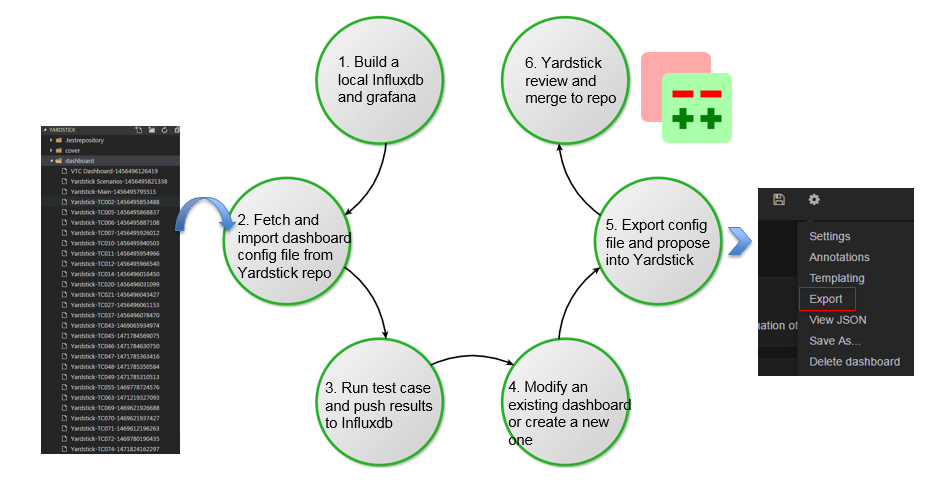
- You need to build a local influxdb and grafana, so you can do the work locally. You can refer to How to deploy InfluxDB and Grafana locally wiki page about how to do this.
- Once step one is done, you can fetch the existing grafana dashboard configuration file from the yardstick repository and import it to your local grafana. After import is done, you grafana dashboard will be ready to use just like the community’s dashboard.
- The third step is running some test cases to generate test results and publishing it to your local influxdb.
- Now you have some data to visualize in your dashboard. In the fourth step, it is time to create your own dashboard. You can either modify an existing dashboard or try to create a new one from scratch. If you choose to modify an existing dashboard then in the curtain menu of the existing dashboard do a “Save As…” into a new dashboard copy instance, and then continue doing all updates and saves within the dashboard copy.
- When finished with all Grafana configuration changes in this temporary
dashboard then chose “export” of the updated dashboard copy into a JSON file
and put it up for review in Gerrit, in file
/yardstick/dashboard/Yardstick-TCxxx-yyyyyyyyyyyyy. For instance a typical default name of the file would beYardstick-TC001 Copy-1234567891234. - Once you finish your dashboard, the next step is exporting the configuration file and propose a patch into Yardstick. Yardstick team will review and merge it into Yardstick repository. After approved review Yardstick team will do an “import” of the JSON file and also a “save dashboard” as soon as possible to replace the old live dashboard configuration.