3.7. Introduction
This document describes the steps to create a new NSB PROX test based on existing PROX functionalities. NSB PROX provides is a simple approximation of an operation and can be used to develop best practices and TCO models for Telco customers, investigate the impact of new Intel compute, network and storage technologies, characterize performance, and develop optimal system architectures and configurations.
NSB PROX Supports Baremetal, Openstack and standalone configuration.
3.8. Prerequisites
In order to integrate PROX tests into NSB, the following prerequisites are required.
A working knowledge of Yardstick. See yardstick wiki page.
A working knowledge of PROX. See Prox documentation.
Knowledge of Openstack. See openstack wiki page.
Knowledge of how to use Grafana. See grafana getting started.
How to Deploy InfluxDB & Grafana. See grafana deployment.
How to use Grafana in OPNFV/Yardstick. See opnfv grafana dashboard.
How to install NSB. See NSB Installation
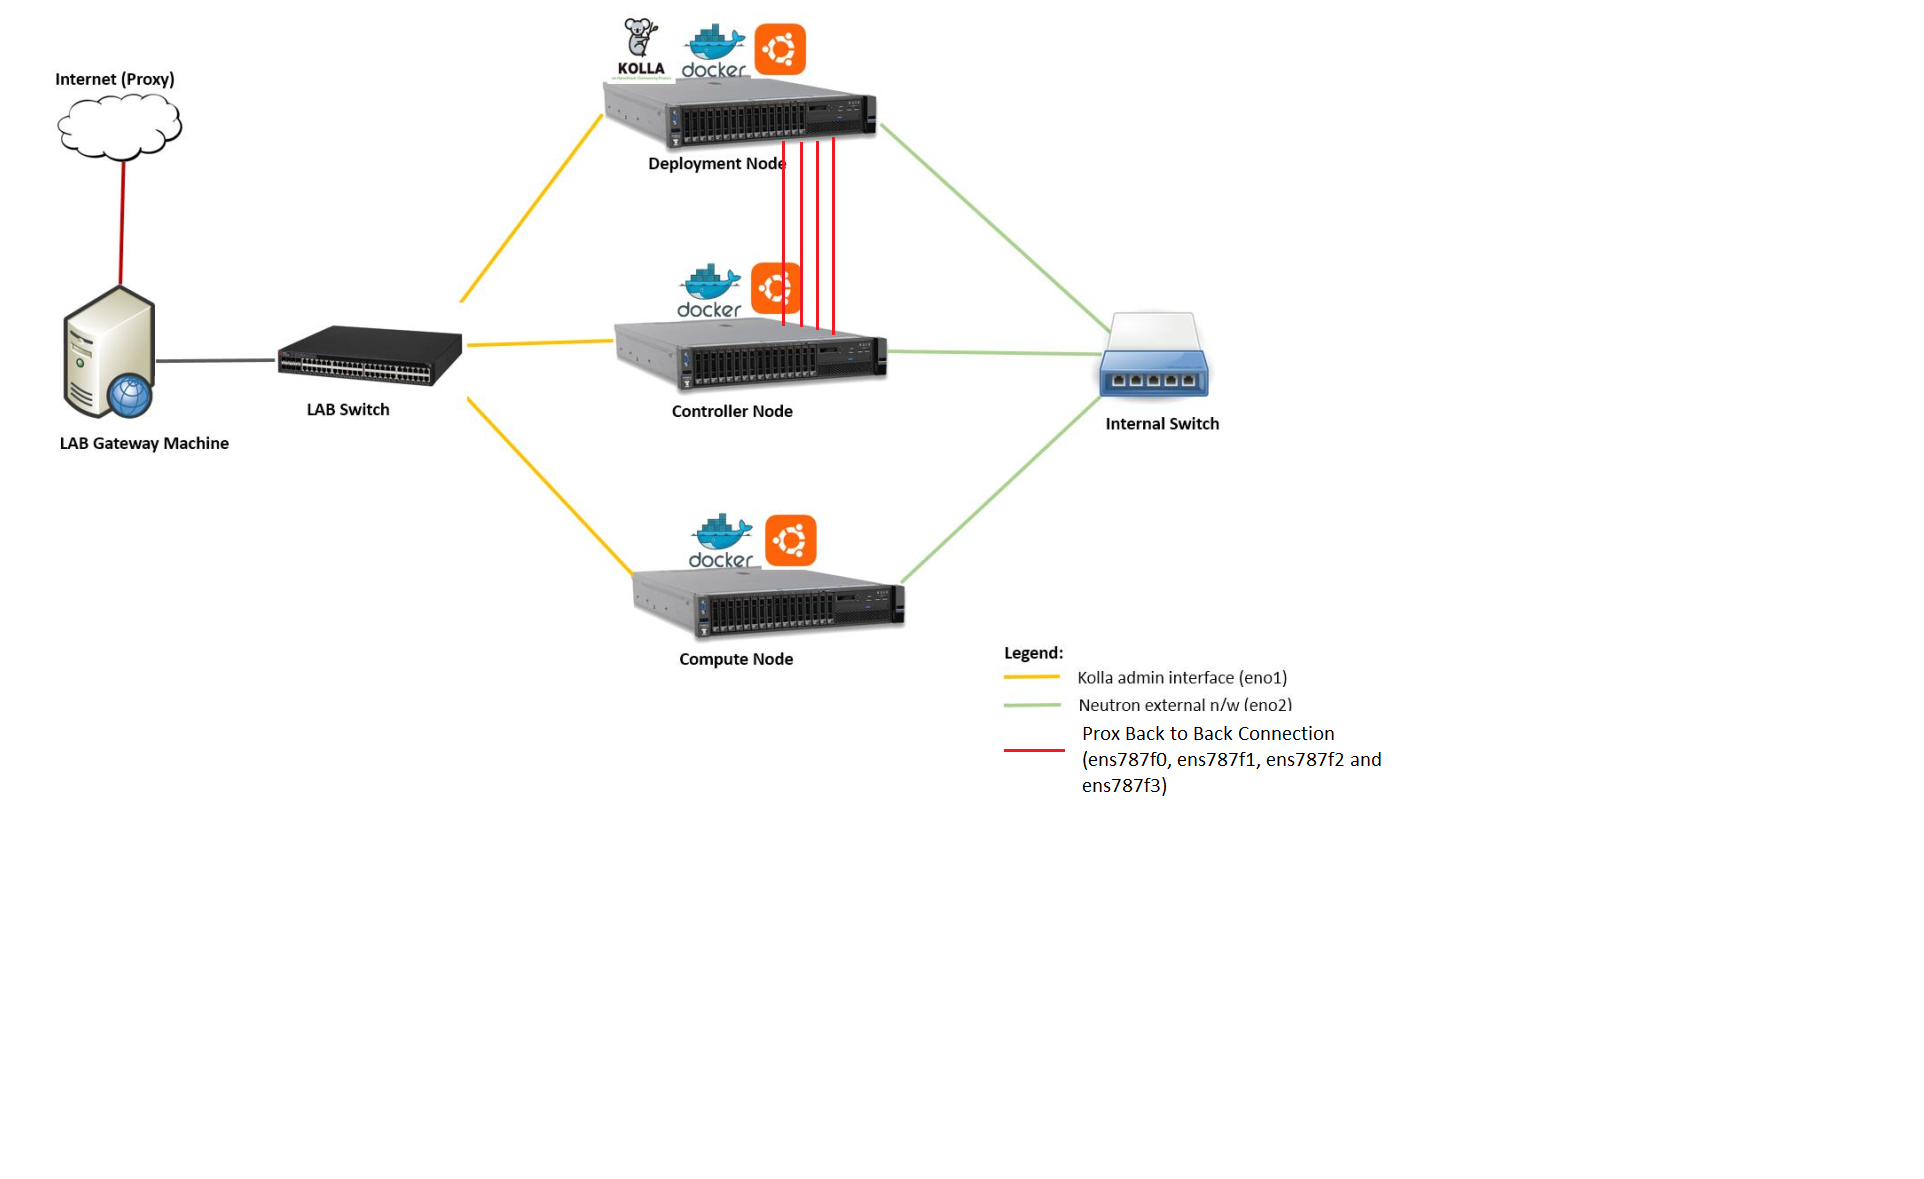
3.9. Sample Prox Test Hardware Architecture
The following is a diagram of a sample NSB PROX Hardware Architecture for both NSB PROX on Bare metal and on Openstack.
In this example when running yardstick on baremetal, yardstick will run on the deployment node, the generator will run on the deployment node and the SUT(SUT) will run on the Controller Node.
3.10. Prox Test Architecture
In order to create a new test, one must understand the architecture of the test.
A NSB Prox test architecture is composed of:
A traffic generator. This provides blocks of data on 1 or more ports to the SUT. The traffic generator also consumes the result packets from the system under test.
A SUT consumes the packets generated by the packet generator, and applies one or more tasks to the packets and return the modified packets to the traffic generator.
This is an example of a sample NSB PROX test architecture.
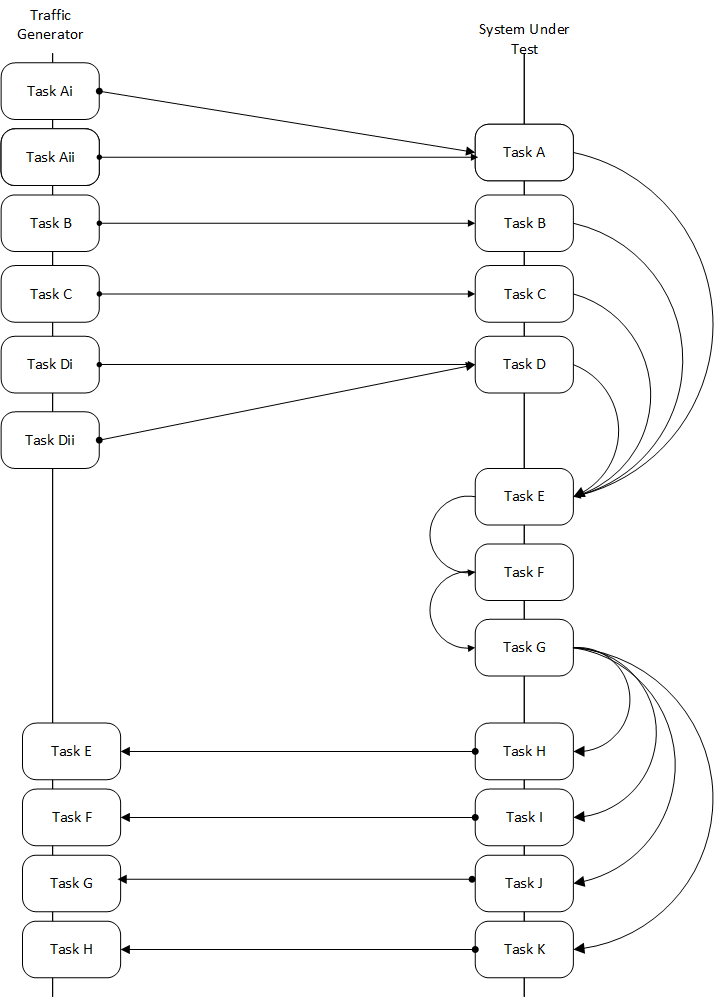
This diagram is of a sample NSB PROX test application.
Traffic Generator
Generator Tasks - Composted of 1 or more tasks (It is possible to have multiple tasks sending packets to same port No. See Tasks Ai and Aii plus Di and Dii)
Task Ai - Generates Packets on Port 0 of Traffic Generator and send to Port 0 of SUT Port 0
Task Aii - Generates Packets on Port 0 of Traffic Generator and send to Port 0 of SUT Port 0
Task B - Generates Packets on Port 1 of Traffic Generator and send to Port 1 of SUT Port 1
Task C - Generates Packets on Port 2 of Traffic Generator and send to Port 2 of SUT Port 2
Task Di - Generates Packets on Port 3 of Traffic Generator and send to Port 3 of SUT Port 3
Task Dii - Generates Packets on Port 0 of Traffic Generator and send to Port 0 of SUT Port 0
Verifier Tasks - Composed of 1 or more tasks which receives packets from SUT
Task E - Receives packets on Port 0 of Traffic Generator sent from Port 0 of SUT Port 0
Task F - Receives packets on Port 1 of Traffic Generator sent from Port 1 of SUT Port 1
Task G - Receives packets on Port 2 of Traffic Generator sent from Port 2 of SUT Port 2
Task H - Receives packets on Port 3 of Traffic Generator sent from Port 3 of SUT Port 3
SUT
Receiver Tasks - Receives packets from generator - Composed on 1 or more tasks which consume the packs sent from Traffic Generator
Task A - Receives Packets on Port 0 of System-Under-Test from Traffic Generator Port 0, and forwards packets to Task E
Task B - Receives Packets on Port 1 of System-Under-Test from Traffic Generator Port 1, and forwards packets to Task E
Task C - Receives Packets on Port 2 of System-Under-Test from Traffic Generator Port 2, and forwards packets to Task E
Task D - Receives Packets on Port 3 of System-Under-Test from Traffic Generator Port 3, and forwards packets to Task E
Processing Tasks - Composed of multiple tasks in series which carry out some processing on received packets before forwarding to the task.
Task E - This receives packets from the Receiver Tasks, carries out some operation on the data and forwards to result packets to the next task in the sequence - Task F
Task F - This receives packets from the previous Task - Task E, carries out some operation on the data and forwards to result packets to the next task in the sequence - Task G
Task G - This receives packets from the previous Task - Task F and distributes the result packages to the Transmitter tasks
Transmitter Tasks - Composed on 1 or more tasks which send the processed packets back to the Traffic Generator
Task H - Receives Packets from Task G of System-Under-Test and sends packets to Traffic Generator Port 0
Task I - Receives Packets from Task G of System-Under-Test and sends packets to Traffic Generator Port 1
Task J - Receives Packets from Task G of System-Under-Test and sends packets to Traffic Generator Port 2
Task K - Receives Packets From Task G of System-Under-Test and sends packets to Traffic Generator Port 3
3.11. NSB Prox Test
A NSB Prox test is composed of the following components :-
Test Description File. Usually called
tc_prox_<context>_<test>-<ports>.yamlwhere<context> is either
baremetalorheat_context<test> is the a one or 2 word description of the test.
<ports> is the number of ports used
Example tests
tc_prox_baremetal_l2fwd-2.yamlortc_prox_heat_context_vpe-4.yaml. This file describes the components of the test, in the case of openstack the network description and server descriptions, in the case of baremetal the hardware description location. It also contains the name of the Traffic Generator, the SUT config file and the traffic profile description, all described below. See Test Description FileTraffic Profile file. Example
prox_binsearch.yaml. This describes the packet size, tolerated loss, initial line rate to start traffic at, test interval etc See Traffic Profile FileTraffic Generator Config file. Usually called
gen_<test>-<ports>.cfg.This describes the activity of the traffic generator
What each core of the traffic generator does,
The packet of data sent by a core on a port of the traffic generator to the system under test
What core is used to wait on what port for data from the system under test.
Example traffic generator config file
gen_l2fwd-4.cfgSee Traffic Generator Config fileSUT Config file. Usually called
handle_<test>-<ports>.cfg.This describes the activity of the SUTs
What each core of the does,
What cores receives packets from what ports
What cores perform operations on the packets and pass the packets onto another core
What cores receives packets from what cores and transmit the packets on the ports to the Traffic Verifier tasks of the Traffic Generator.
Example traffic generator config file
handle_l2fwd-4.cfgSee SUT Config FileNSB PROX Baremetal Configuration file. Usually called
prox-baremetal-<ports>.yaml<ports> is the number of ports used
This is required for baremetal only. This describes hardware, NICs, IP addresses, Network drivers, usernames and passwords. See Baremetal Configuration File
Grafana Dashboard. Usually called
Prox_<context>_<test>-<port>-<DateAndTime>.jsonwhere<context> Is
BM,``heat``,``ovs_dpdk`` orsriov<test> Is the a one or 2 word description of the test.
<port> is the number of ports used express as
2Portor4Port<DateAndTime> is the Date and Time expressed as a string.
Example grafana dashboard
Prox_BM_L2FWD-4Port-1507804504588.json
Other files may be required. These are test specific files and will be covered later.
3.11.1. Test Description File
Here we will discuss the test description for baremetal, openstack and standalone.
3.11.2. Test Description File for Baremetal
This section will introduce the meaning of the Test case description
file. We will use tc_prox_baremetal_l2fwd-2.yaml as an example to
show you how to understand the test description file.
Now let’s examine the components of the file in detail
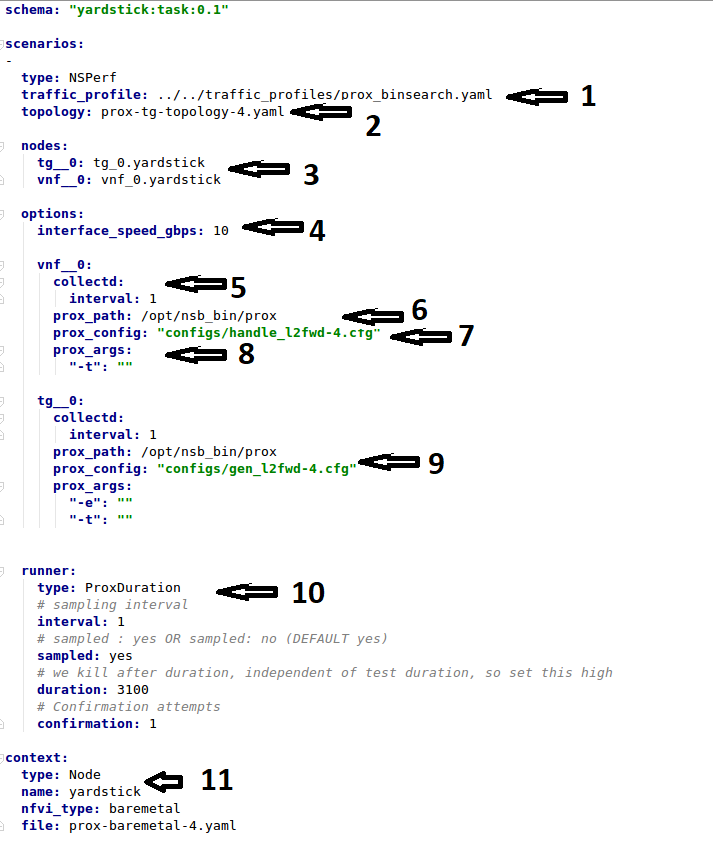
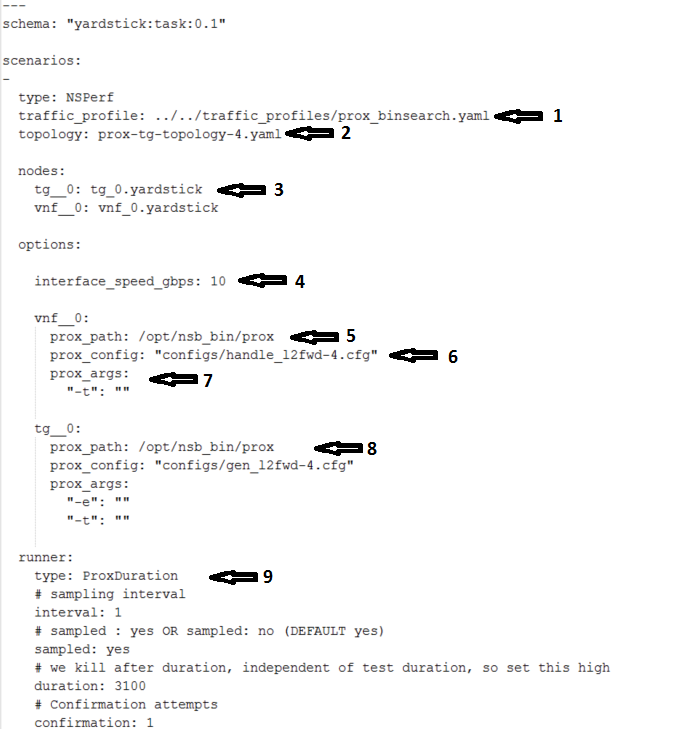
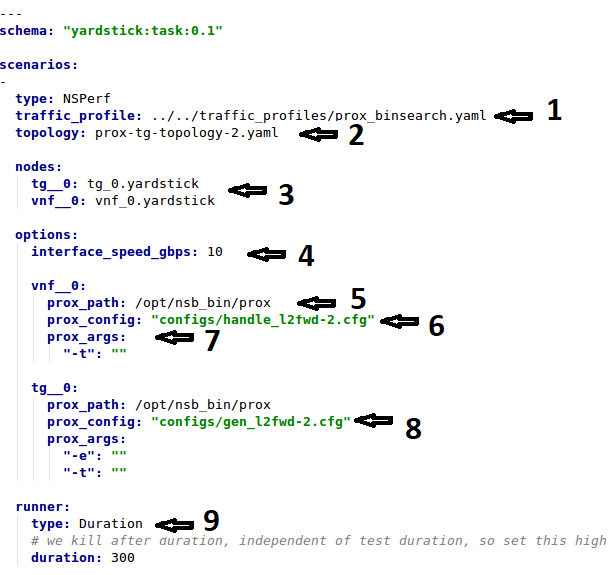
traffic_profile- This specifies the traffic profile for the test. In this caseprox_binsearch.yamlis used. See Traffic Profile Filetopology- This is eitherprox-tg-topology-1.yamlorprox-tg-topology-2.yamlorprox-tg-topology-4.yamldepending on number of ports required.
nodes- This names the Traffic Generator and the System under Test. Does not need to change.interface_speed_gbps- This is an optional parameter. If not present the system defaults to 10Gbps. This defines the speed of the interfaces.collectd- (Optional) This specifies we want to collect NFVI statistics like CPU Utilization,prox_path- Location of the Prox executable on the traffic generator (Either baremetal or Openstack Virtual Machine)prox_config- This is theSUT Config File. In this case it ishandle_l2fwd-2.cfgA number of additional parameters can be added. This example is for VPE:
options: interface_speed_gbps: 10 traffic_config: tolerated_loss: 0.01 test_precision: 0.01 packet_sizes: [64] duration: 30 lower_bound: 0.0 upper_bound: 100.0 vnf__0: prox_path: /opt/nsb_bin/prox prox_config: ``configs/handle_vpe-4.cfg`` prox_args: ``-t``: ```` prox_files: ``configs/vpe_ipv4.lua`` : ```` ``configs/vpe_dscp.lua`` : ```` ``configs/vpe_cpe_table.lua`` : ```` ``configs/vpe_user_table.lua`` : ```` ``configs/vpe_rules.lua`` : ```` prox_generate_parameter: True ``interface_speed_gbps`` - this specifies the speed of the interface in Gigabits Per Second. This is used to calculate pps(packets per second). If the interfaces are of different speeds, then this specifies the speed of the slowest interface. This parameter is optional. If omitted the interface speed defaults to 10Gbps. ``traffic_config`` - This allows the values here to override the values in in the traffic_profile file. e.g. "prox_binsearch.yaml". Values provided here override values provided in the "traffic_profile" section of the traffic_profile file. Some, all or none of the values can be provided here. The values describes the packet size, tolerated loss, initial line rate to start traffic at, test interval etc See `Traffic Profile File`_ ``prox_files`` - this specified that a number of addition files need to be provided for the test to run correctly. This files could provide routing information,hashing information or a hashing algorithm and ip/mac information. ``prox_generate_parameter`` - this specifies that the NSB application is required to provide information to the nsb Prox in the form of a file called ``parameters.lua``, which contains information retrieved from either the hardware or the openstack configuration.prox_args- this specifies the command line arguments to start prox. See prox command line.prox_config- This specifies the Traffic Generator config file.runner- This is set toProxDuration- This specifies that the test runs for a set duration. Other runner types are available but it is recommend to useProxDuration. The following parameters are supportedinterval- (optional) - This specifies the sampling interval. Default is 1 secsampled- (optional) - This specifies if sampling information is required. Defaultnoduration- This is the length of the test in seconds. Default is 60 seconds.confirmation- This specifies the number of confirmation retests to be made before deciding to increase or decrease line speed. Default 0.context- This iscontextfor a 2 port Baremetal configuration.
If a 4 port configuration was required then file
prox-baremetal-4.yamlwould be used. This is the NSB Prox baremetal configuration file.
3.11.3. Traffic Profile File
This describes the details of the traffic flow. In this case
prox_binsearch.yaml is used.
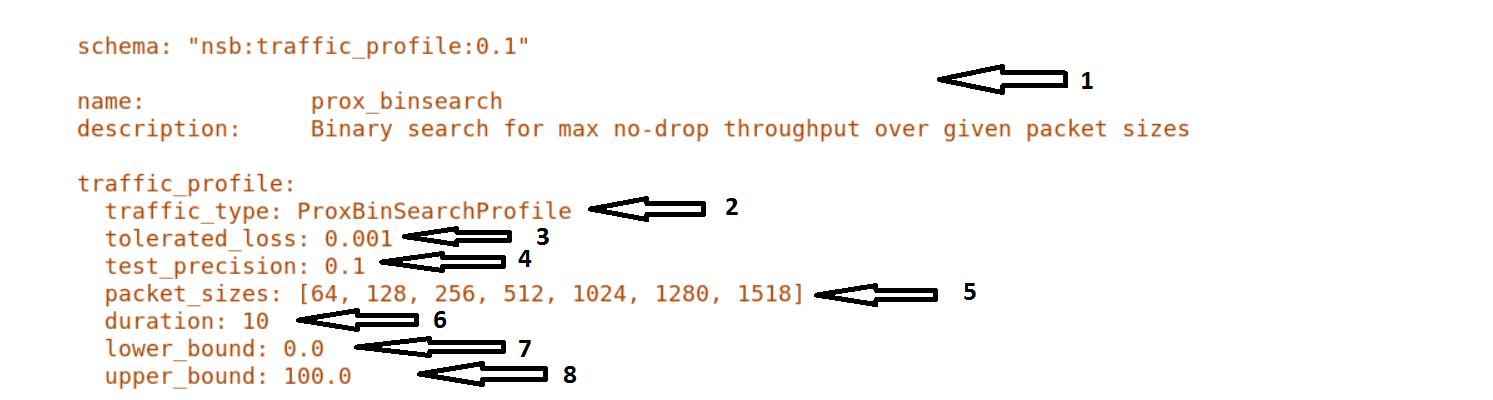
name- The name of the traffic profile. This name should match the name specified in thetraffic_profilefield in the Test Description File.traffic_type- This specifies the type of traffic pattern generated, This name matches class name of the traffic generator. See:network_services/traffic_profile/prox_binsearch.py class ProxBinSearchProfile(ProxProfile)
In this case it lowers the traffic rate until the number of packets sent is equal to the number of packets received (plus a tolerated loss). Once it achieves this it increases the traffic rate in order to find the highest rate with no traffic loss.
Custom traffic types can be created by creating a new traffic profile class.
tolerated_loss- This specifies the percentage of packets that can be lost/dropped before we declare success or failure. Success is Transmitted-Packets from Traffic Generator is greater than or equal to packets received by Traffic Generator plus tolerated loss.test_precision- This specifies the precision of the test results. For some tests the success criteria may never be achieved because the test precision may be greater than the successful throughput. For finer results increase the precision by making this value smaller.packet_sizes- This specifies the range of packets size this test is run for.duration- This specifies the sample duration that the test uses to check for success or failure.lower_bound- This specifies the test initial lower bound sample rate. On success this value is increased.upper_bound- This specifies the test initial upper bound sample rate. On success this value is decreased.
Other traffic profiles exist eg prox_ACL.yaml which does not compare what is received with what is transmitted. It just sends packet at max rate.
It is possible to create custom traffic profiles with by creating new file in the same folder as prox_binsearch.yaml. See this prox_vpe.yaml as example:
schema: ``nsb:traffic_profile:0.1``

name:            prox_vpe
description:     Prox vPE traffic profile

traffic_profile:
  traffic_type: ProxBinSearchProfile
  tolerated_loss: 100.0 #0.001
  test_precision: 0.01
# The minimum size of the Ethernet frame for the vPE test is 68 bytes.
  packet_sizes: [68]
  duration: 5
  lower_bound: 0.0
  upper_bound: 100.0
3.11.4. Test Description File for Openstack
We will use tc_prox_heat_context_l2fwd-2.yaml as a example to show
you how to understand the test description file.
Now lets examine the components of the file in detail
Sections 1 to 9 are exactly the same in Baremetal and in Heat. Section
10 is replaced with sections A to F. Section 10 was for a baremetal
configuration file. This has no place in a heat configuration.
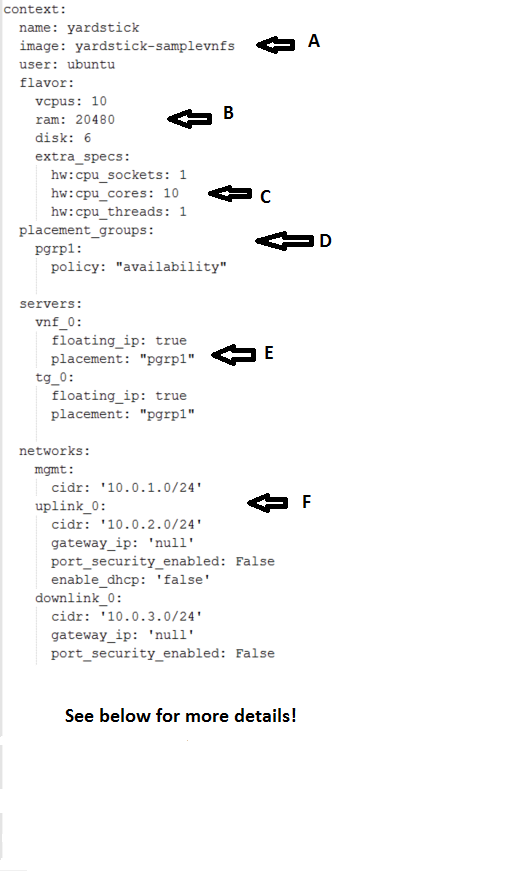
image- yardstick-samplevnfs. This is the name of the image created during the installation of NSB. This is fixed.flavor- The flavor is created dynamically. However we could use an already existing flavor if required. In that case the flavor would be named:flavor: yardstick-flavor
extra_specs- This allows us to specify the number of cores sockets and hyperthreading assigned to it. In this case we have 1 socket with 10 codes and no hyperthreading enabled.placement_groups- default. Do not change for NSB PROX.servers-tg_0is the traffic generator andvnf_0is the system under test.networks- is composed of a management network labeledmgmtand one uplink network labeleduplink_0and one downlink network labeleddownlink_0for 2 ports. If this was a 4 port configuration there would be 2 extra downlink ports. See this example from a 4 port l2fwd test.:networks: mgmt: cidr: '10.0.1.0/24' uplink_0: cidr: '10.0.2.0/24' gateway_ip: 'null' port_security_enabled: False enable_dhcp: 'false' downlink_0: cidr: '10.0.3.0/24' gateway_ip: 'null' port_security_enabled: False enable_dhcp: 'false' uplink_1: cidr: '10.0.4.0/24' gateway_ip: 'null' port_security_enabled: False enable_dhcp: 'false' downlink_1: cidr: '10.0.5.0/24' gateway_ip: 'null' port_security_enabled: False enable_dhcp: 'false'
3.11.5. Test Description File for Standalone
We will use tc_prox_ovs-dpdk_l2fwd-2.yaml as a example to show
you how to understand the test description file.
Now lets examine the components of the file in detail
Sections 1 to 9 are exactly the same in Baremetal and in Heat. Section
10 is replaced with sections A to F. Section 10 was for a baremetal
configuration file. This has no place in a heat configuration.
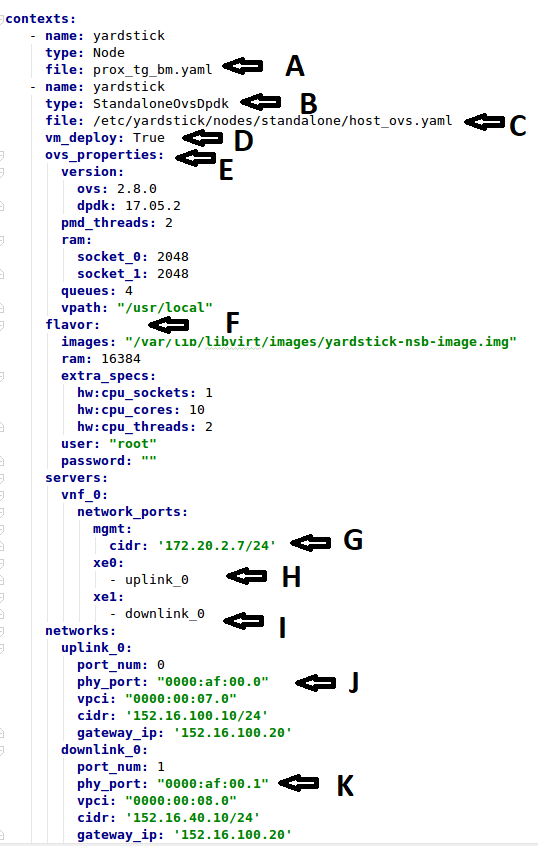
file- Pod file for Baremetal Traffic Generator configuration: IP Address, User/Password & Interfacestype- This defines the type of standalone configuration. Possible values areStandaloneOvsDpdkorStandaloneSriovfile- Pod file for Standalone host configuration: IP Address, User/Password & Interfacesvm_deploy- Deploy a new VM or use an existing VMovs_properties- OVS Version, DPDK Version and configuration to use.flavor- NSB image generated when installing NSB using ansible-playbook:ram- Configurable RAM for SUT VM extra_specs hw:cpu_sockets - Configurable number of Sockets for SUT VM hw:cpu_cores - Configurable number of Cores for SUT VM hw:cpu_threads- Configurable number of Threads for SUT VM
mgmt- Management port of the SUT VM. Preconfig needed on TG & SUT host machines. is the system under test.xe0- Upline Network portxe1- Downline Network portuplink_0- Uplink Phy port of the NIC on the host. This will be used to create the Virtual Functions.downlink_0- Downlink Phy port of the NIC on the host. This will be used to create the Virtual Functions.
3.11.6. Traffic Generator Config file
This section will describe the traffic generator config file.
This is the same for both baremetal and heat. See this example
of gen_l2fwd_multiflow-2.cfg to explain the options.
The configuration file is divided into multiple sections, each of which is used to define some parameters and options.:
[eal options]
[variables]
[port 0]
[port 1]
[port .]
[port Z]
[defaults]
[global]
[core 0]
[core 1]
[core 2]
[core .]
[core Z]
See prox options for details
Now let’s examine the components of the file in detail
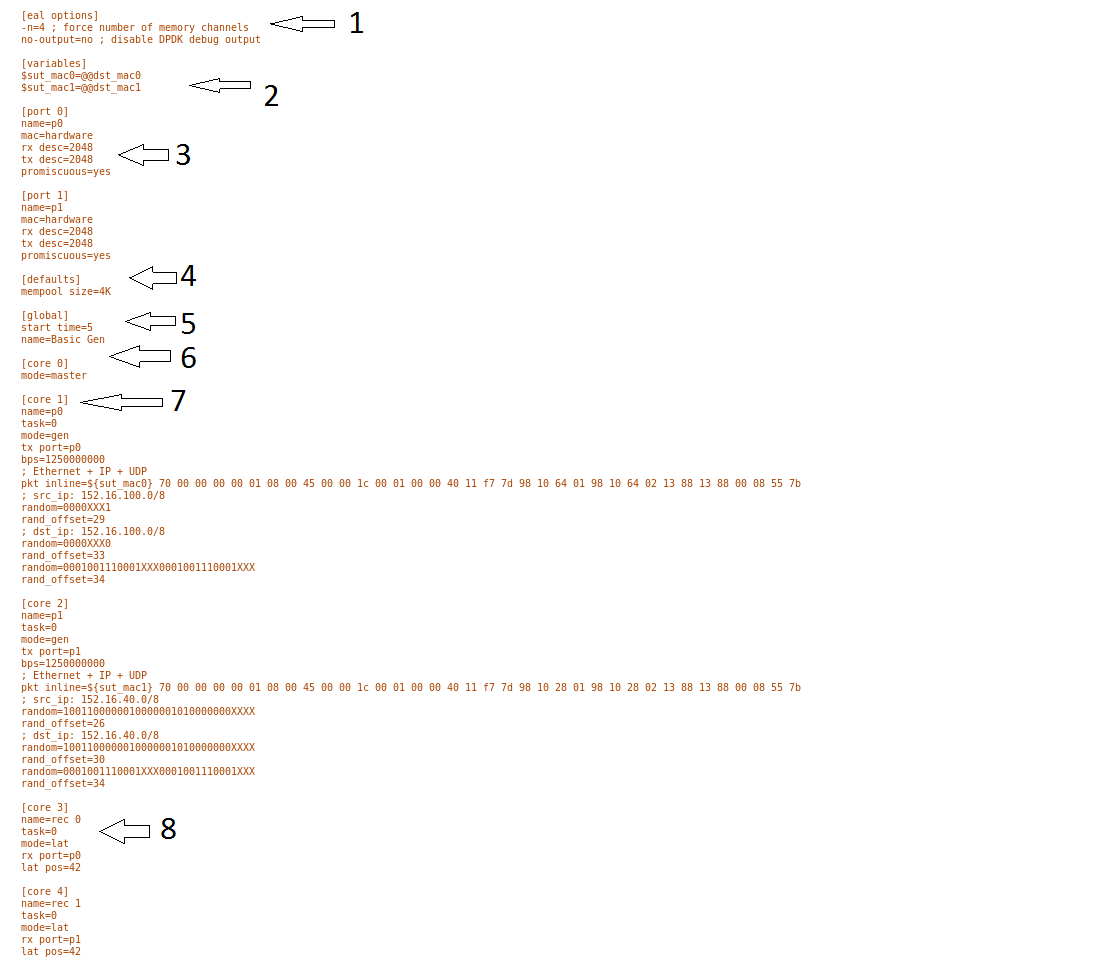
[eal options]- This specified the EAL (Environmental Abstraction Layer) options. These are default values and are not changed. See dpdk wiki page.[variables]- This section contains variables, as the name suggests. Variables for Core numbers, mac addresses, ip addresses etc. They are assigned as akey = valuewhere the key is used in place of the value.Caution
A special case for valuables with a value beginning with
@@. These values are dynamically updated by the NSB application at run time. Values like MAC address, IP Address etc.[port 0]- This section describes the DPDK Port. The number following the keywordportusually refers to the DPDK Port Id. usually starting from0. Because you can have multiple ports this entry usually repeated. Eg. For a 2 port setup[port0]and[port 1]and for a 4 port setup[port 0],[port 1],[port 2]and[port 3]:[port 0] name=p0 mac=hardware rx desc=2048 tx desc=2048 promiscuous=yes
In this example
name = p0assigned the namep0to the port. Any name can be assigned to a port.mac=hardwaresets the MAC address assigned by the hardware to data from this port.rx desc=2048sets the number of available descriptors to allocate for receive packets. This can be changed and can effect performance.tx desc=2048sets the number of available descriptors to allocate for transmit packets. This can be changed and can effect performance.promiscuous=yesthis enables promiscuous mode for this port.
[defaults]- Here default operations and settings can be over written. In this examplemempool size=4Kthe number of mbufs per task is altered. Altering this value could effect performance. See prox options for details.[global]- Here application wide setting are supported. Things like application name, start time, duration and memory configurations can be set here. In this example.:[global] start time=5 name=Basic Gen a. ``start time=5`` Time is seconds after which average stats will be started. b. ``name=Basic Gen`` Name of the configuration.
[core 0]- This core is designated the master core. Every Prox application must have a master core. The master mode must be assigned to exactly one task, running alone on one core.:[core 0] mode=master
[core 1]- This describes the activity on core 1. Cores can be configured by means of a set of [core #] sections, where # represents either:an absolute core number: e.g. on a 10-core, dual socket system with hyper-threading, cores are numbered from 0 to 39.
PROX allows a core to be identified by a core number, the letter ‘s’, and a socket number.
It is possible to write a baremetal and an openstack test which use the same traffic generator config file and SUT config file. In this case it is advisable not to use physical core numbering.
However it is also possible to write NSB Prox tests that have been optimized for a particular hardware configuration. In this case it is advisable to use the core numbering. It is up to the user to make sure that cores from the right sockets are used (i.e. from the socket on which the NIC is attached to), to ensure good performance (EPA).
Each core can be assigned with a set of tasks, each running one of the implemented packet processing modes.:
[core 1] name=p0 task=0 mode=gen tx port=p0 bps=1250000000 ; Ethernet + IP + UDP pkt inline=${sut_mac0} 70 00 00 00 00 01 08 00 45 00 00 1c 00 01 00 00 40 11 f7 7d 98 10 64 01 98 10 64 02 13 88 13 88 00 08 55 7b ; src_ip: 152.16.100.0/8 random=0000XXX1 rand_offset=29 ; dst_ip: 152.16.100.0/8 random=0000XXX0 rand_offset=33 random=0001001110001XXX0001001110001XXX rand_offset=34name=p0- Name assigned to the core.task=0- Each core can run a set of tasks. Starting with0. Task 1 can be defined later in this core or can be defined in another[core 1]section withtask=1later in configuration file. Sometimes running multiple task related to the same packet on the same physical core improves performance, however sometimes it is optimal to move task to a separate core. This is best decided by checking performance.mode=gen- Specifies the action carried out by this task on this core. Supported modes are: classify, drop, gen, lat, genl4, nop, l2fwd, gredecap, greencap, lbpos, lbnetwork, lbqinq, lb5tuple, ipv6_decap, ipv6_encap, qinqdecapv4, qinqencapv4, qos, routing, impair, mirror, unmpls, tagmpls, nat, decapnsh, encapnsh, police, acl Which are :-Classify
Drop
Basic Forwarding (no touch)
L2 Forwarding (change MAC)
GRE encap/decap
Load balance based on packet fields
Symmetric load balancing
QinQ encap/decap IPv4/IPv6
ARP
QoS
Routing
Unmpls
Nsh encap/decap
Policing
ACL
In the traffic generator we expect a core to generate packets (
gen) and to receive packets & calculate latency (lat) This core doesgen. ie it is a traffic generator.To understand what each of the modes support please see prox documentation.
tx port=p0- This specifies that the packets generated are transmitted to portp0bps=1250000000- This indicates Bytes Per Second to generate packets.; Ethernet + IP + UDP- This is a comment. Items starting with;are ignored.pkt inline=${sut_mac0} 70 00 00 00 ...- Defines the packet format as a sequence of bytes (each expressed in hexadecimal notation). This defines the packet that is generated. This packets begins with the hexadecimal sequence assigned tosut_macand the remainder of the bytes in the string. This packet could now be sent or modified byrandom=..described below before being sent to target.; src_ip: 152.16.100.0/8- Commentrandom=0000XXX1- This describes a field of the packet containing random data. This string can be 8,16,24 or 32 character long and represents 1,2,3 or 4 bytes of data. In this case it describes a byte of data. Each character in string can be 0,1 orX. 0 or 1 are fixed bit values in the data packet andXis a random bit. So random=0000XXX1 generates 00000001(1), 00000011(3), 00000101(5), 00000111(7), 00001001(9), 00001011(11), 00001101(13) and 00001111(15) combinations.rand_offset=29- Defines where to place the previously defined random field.; dst_ip: 152.16.100.0/8- Commentrandom=0000XXX0- This is another random field which generates a byte of 00000000(0), 00000010(2), 00000100(4), 00000110(6), 00001000(8), 00001010(10), 00001100(12) and 00001110(14) combinations.rand_offset=33- Defines where to place the previously defined random field.random=0001001110001XXX0001001110001XXX- This is another random field which generates 4 bytes.rand_offset=34- Defines where to place the previously defined 4 byte random field.
Core 2 executes same scenario as Core 1. The only difference in this case is that the packets are generated for Port 1.
[core 3]- This defines the activities on core 3. The purpose ofcore 3andcore 4is to receive packets sent by the SUT.:[core 3] name=rec 0 task=0 mode=lat rx port=p0 lat pos=42
name=rec 0- Name assigned to the core.task=0- Each core can run a set of tasks. Starting with0. Task 1 can be defined later in this core or can be defined in another[core 1]section withtask=1later in configuration file. Sometimes running multiple task related to the same packet on the same physical core improves performance, however sometimes it is optimal to move task to a separate core. This is best decided by checking performance.mode=lat- Specifies the action carried out by this task on this core. Supported modes are:acl,classify,drop,gredecap,greencap,ipv6_decap,ipv6_encap,l2fwd,lbnetwork,lbpos,lbqinq,nop,police,qinqdecapv4,qinqencapv4,qos,routing,impair,lb5tuple,mirror,unmpls,tagmpls,nat,decapnsh,encapnsh,gen,genl4andlat. This task(0) per core(3) receives packets on port.rx port=p0- The port to receive packets onPort 0. Core 4 will receive packets onPort 1.lat pos=42- Describes where to put a 4-byte timestamp in the packet. Note that the packet length should be longer thanlat pos+ 4 bytes to avoid truncation of the timestamp. It defines where the timestamp is to be read from. Note that the SUT workload might cause the position of the timestamp to change (i.e. due to encapsulation).
3.11.7. SUT Config File
This section will describes the SUT(VNF) config file. This is the same for both
baremetal and heat. See this example of handle_l2fwd_multiflow-2.cfg to
explain the options.
See prox options for details
Now let’s examine the components of the file in detail
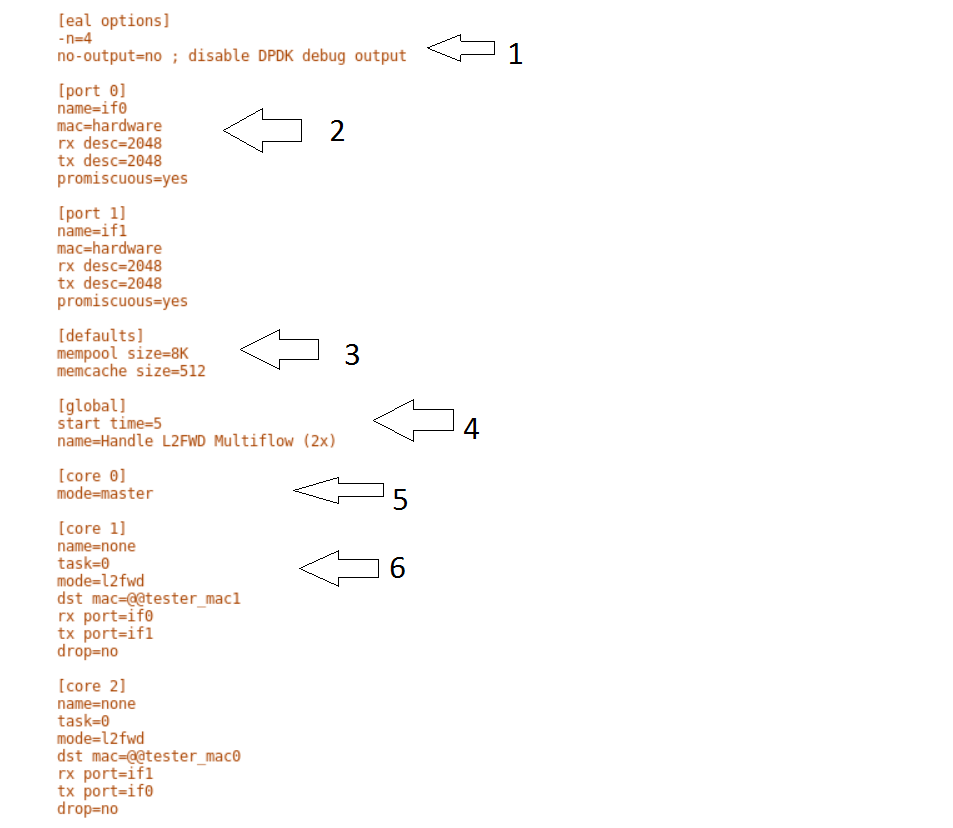
[eal options]- same as the Generator config file. This specified the EAL (Environmental Abstraction Layer) options. These are default values and are not changed. See dpdk wiki page.[port 0]- This section describes the DPDK Port. The number following the keywordportusually refers to the DPDK Port Id. usually starting from0. Because you can have multiple ports this entry usually repeated. E.g. For a 2 port setup[port0]and[port 1]and for a 4 port setup[port 0],[port 1],[port 2]and[port 3]:[port 0] name=if0 mac=hardware rx desc=2048 tx desc=2048 promiscuous=yes
In this example
name =if0assigned the nameif0to the port. Any name can be assigned to a port.mac=hardwaresets the MAC address assigned by the hardware to data from this port.rx desc=2048sets the number of available descriptors to allocate for receive packets. This can be changed and can effect performance.tx desc=2048sets the number of available descriptors to allocate for transmit packets. This can be changed and can effect performance.promiscuous=yesthis enables promiscuous mode for this port.
[defaults]- Here default operations and settings can be over written.:[defaults] mempool size=8K memcache size=512
In this example
mempool size=8Kthe number of mbufs per task is altered. Altering this value could effect performance. See prox options for details.memcache size=512- number of mbufs cached per core, default is 256 this is the cache_size. Altering this value could affect performance.
[global]- Here application wide setting are supported. Things like application name, start time, duration and memory configurations can be set here. In this example.:[global] start time=5 name=Basic Gen a. ``start time=5`` Time is seconds after which average stats will be started. b. ``name=Handle L2FWD Multiflow (2x)`` Name of the configuration.
[core 0]- This core is designated the master core. Every Prox application must have a master core. The master mode must be assigned to exactly one task, running alone on one core.:[core 0] mode=master
[core 1]- This describes the activity on core 1. Cores can be configured by means of a set of [core #] sections, where # represents either:an absolute core number: e.g. on a 10-core, dual socket system with hyper-threading, cores are numbered from 0 to 39.
PROX allows a core to be identified by a core number, the letter ‘s’, and a socket number. However NSB PROX is hardware agnostic (physical and virtual configurations are the same) it is advisable no to use physical core numbering.
Each core can be assigned with a set of tasks, each running one of the implemented packet processing modes.:
[core 1]
name=none
task=0
mode=l2fwd
dst mac=@@tester_mac1
rx port=if0
tx port=if1
name=none- No name assigned to the core.task=0- Each core can run a set of tasks. Starting with0. Task 1 can be defined later in this core or can be defined in another[core 1]section withtask=1later in configuration file. Sometimes running multiple task related to the same packet on the same physical core improves performance, however sometimes it is optimal to move task to a separate core. This is best decided by checking performance.mode=l2fwd- Specifies the action carried out by this task on this core. Supported modes are:acl,classify,drop,gredecap,greencap,ipv6_decap,ipv6_encap,l2fwd,lbnetwork,lbpos,lbqinq,nop,police,qinqdecapv4,qinqencapv4,qos,routing,impair,lb5tuple,mirror,unmpls,tagmpls,nat,decapnsh,encapnsh,gen,genl4andlat. This code doesl2fwd. i.e. it does the L2FWD.dst mac=@@tester_mac1- The destination mac address of the packet will be set to the MAC address ofPort 1of destination device. (The Traffic Generator/Verifier)rx port=if0- This specifies that the packets are received fromPort 0called if0tx port=if1- This specifies that the packets are transmitted toPort 1called if1
In this example we receive a packet on core on a port, carry out operation on the packet on the core and transmit it on on another port still using the same task on the same core.
On some implementation you may wish to use multiple tasks, like this.:
[core 1]
name=rx_task
task=0
mode=l2fwd
dst mac=@@tester_p0
rx port=if0
tx cores=1t1
drop=no

name=l2fwd_if0
task=1
mode=nop
rx ring=yes
tx port=if0
drop=no
In this example you can see Core 1/Task 0 called
rx_taskreceives the packet from if0 and perform the l2fwd. However instead of sending the packet to a port it sends it to a core seetx cores=1t1. In this case it sends it to Core 1/Task 1.Core 1/Task 1 called
l2fwd_if0, receives the packet, not from a port but from the ring. Seerx ring=yes. It does not perform any operation on the packet Seemode=noneand sends the packets toif0seetx port=if0.It is also possible to implement more complex operations by chaining multiple operations in sequence and using rings to pass packets from one core to another.
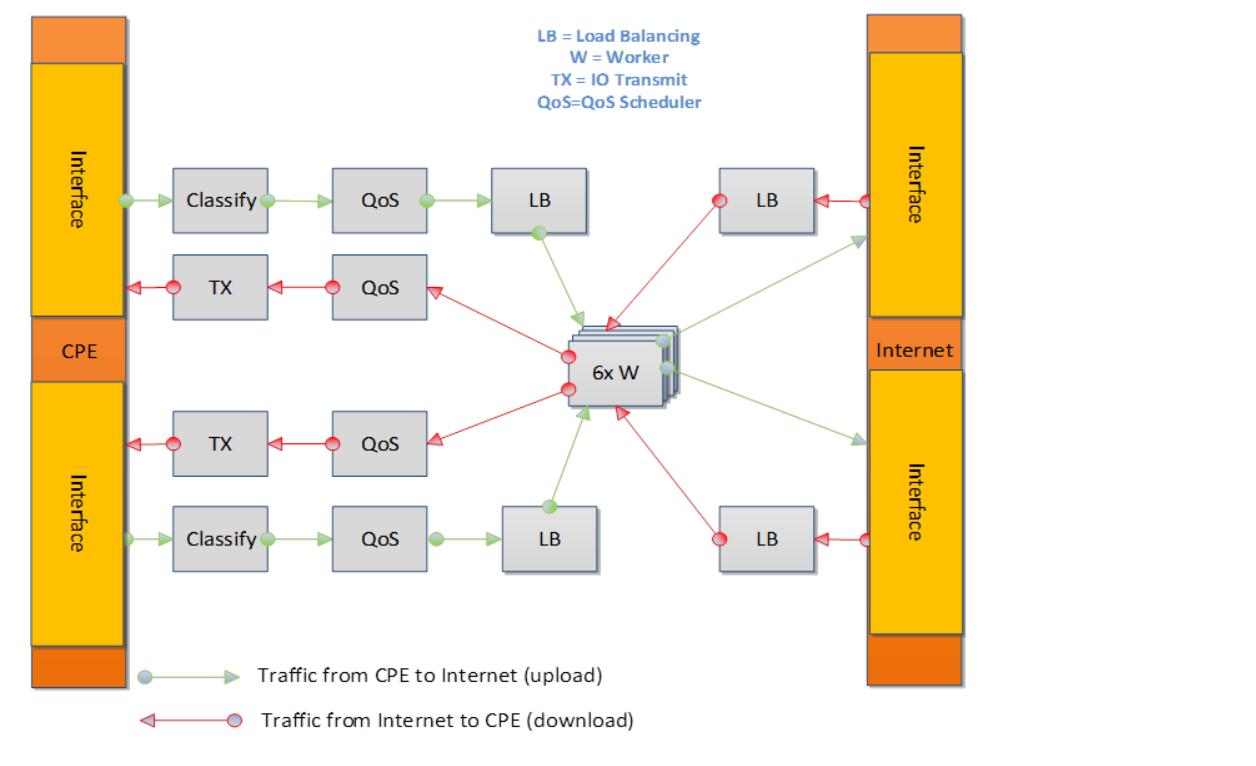
In this example, we show a Broadband Network Gateway (BNG) with Quality of Service (QoS). Communication from task to task is via rings.
3.11.8. Baremetal Configuration File
This is required for baremetal testing. It describes the IP address of the various ports, the Network devices drivers and MAC addresses and the network configuration.
In this example we will describe a 2 port configuration. This file is the same for all 2 port NSB Prox tests on the same platforms/configuration.
Now let’s describe the sections of the file.
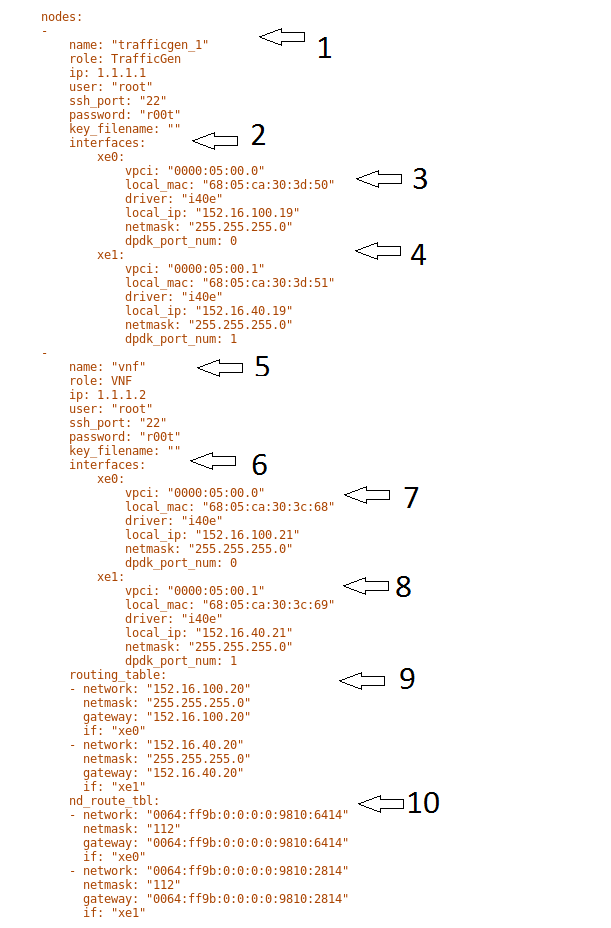
TrafficGen- This section describes the Traffic Generator node of the test configuration. The name of the nodetrafficgen_1must match the node name in theTest Description File for Baremetalmentioned earlier. The password attribute of the test needs to be configured. All other parameters can remain as default settings.
interfaces- This defines the DPDK interfaces on the Traffic Generator.
xe0is DPDK Port 0.lspciand./dpdk-devbind.py -scan be used to provide the interface information.netmaskandlocal_ipshould not be changed
xe1is DPDK Port 1. If more than 2 ports are required thenxe1section needs to be repeated and modified accordingly.
vnf- This section describes the SUT of the test configuration. The name of the nodevnfmust match the node name in theTest Description File for Baremetalmentioned earlier. The password attribute of the test needs to be configured. All other parameters can remain as default settings
interfaces- This defines the DPDK interfaces on the SUT
xe0- Same as 3 but for theSUT.
xe1- Same as 4 but for theSUTalso.
routing_table- All parameters should remain unchanged.
nd_route_tbl- All parameters should remain unchanged.
3.11.9. Grafana Dashboard
The grafana dashboard visually displays the results of the tests. The steps required to produce a grafana dashboard are described here.
Configure
yardstickto use influxDB to store test results. See file/etc/yardstick/yardstick.conf.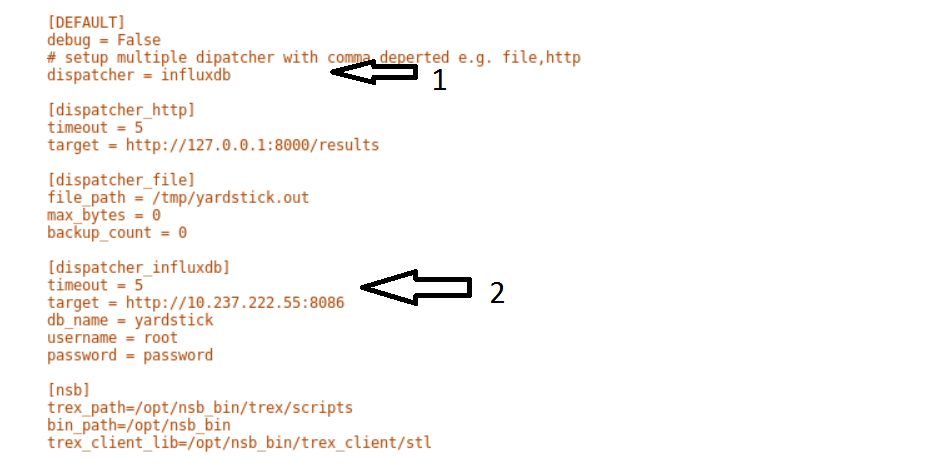
Specify the dispatcher to use influxDB to store results.
“target = .. ” - Specify location of influxDB to store results. “db_name = yardstick” - name of database. Do not change “username = root” - username to use to store result. (Many tests are run as root) “password = … ” - Please set to root user password
Deploy InfludDB & Grafana. See how to Deploy InfluxDB & Grafana. See grafana deployment.
Generate the test data. Run the tests as follows .:
yardstick --debug task start tc_prox_<context>_<test>-ports.yamleg.:
yardstick --debug task start tc_prox_heat_context_l2fwd-4.yamlNow build the dashboard for the test you just ran. The easiest way to do this is to copy an existing dashboard and rename the test and the field names. The procedure to do so is described here. See opnfv grafana dashboard.
3.12. How to run NSB Prox Test on an baremetal environment
In order to run the NSB PROX test.
Install NSB on Traffic Generator node and Prox in SUT. See NSB Installation
To enter container:
docker exec -it yardstick /bin/bashInstall baremetal configuration file (POD files)
Go to location of PROX tests in container
cd /home/opnfv/repos/yardstick/samples/vnf_samples/nsut/proxInstall prox-baremetal-2.yam and prox-baremetal-4.yaml for that topology into this directory as per Baremetal Configuration File
Install and configure
yardstick.confcd /etc/yardstick/Modify /etc/yardstick/yardstick.conf as per yardstick-config-label
Execute the test. Eg.:
yardstick --debug task start ./tc_prox_baremetal_l2fwd-4.yaml
3.13. How to run NSB Prox Test on an Openstack environment
In order to run the NSB PROX test.
Install NSB on Openstack deployment node. See NSB Installation
To enter container:
docker exec -it yardstick /bin/bashInstall configuration file
Goto location of PROX tests in container
cd /home/opnfv/repos/yardstick/samples/vnf_samples/nsut/proxInstall and configure
yardstick.confcd /etc/yardstick/Modify /etc/yardstick/yardstick.conf as per yardstick-config-label
Execute the test. Eg.:
yardstick --debug task start ./tc_prox_heat_context_l2fwd-4.yaml
3.14. Frequently Asked Questions
Here is a list of frequently asked questions.
3.14.1. NSB Prox does not work on Baremetal, How do I resolve this?
If PROX NSB does not work on baremetal, problem is either in network configuration or test file.
Verify network configuration. Execute existing baremetal test.:
yardstick --debug task start ./tc_prox_baremetal_l2fwd-4.yaml
If test does not work then error in network configuration.
Check DPDK on Traffic Generator and SUT via:-
/root/dpdk-17./usertools/dpdk-devbind.py
Verify MAC addresses match
prox-baremetal-<ports>.yamlviaifconfiganddpdk-devbindCheck your eth port is what you expect. You would not be the first person to think that the port your cable is plugged into is ethX when in fact it is ethY. Use ethtool to visually confirm that the eth is where you expect.:
ethtool -p ethX
A led should start blinking on port. (On both System-Under-Test and Traffic Generator)
Check cable.
Install Linux kernel network driver and ensure your ports are
boundto the driver viadpdk-devbind. Bring up port on both SUT and Traffic Generator and check connection.On SUT and on Traffic Generator:
ifconfig ethX/enoX up
Check link
ethtool ethX/enoX
See
Link detectedifyes…. Cable is good. Ifnoyou have an issue with your cable/port.
If existing baremetal works then issue is with your test. Check the traffic generator gen_<test>-<ports>.cfg to ensure it is producing a valid packet.
3.14.2. How do I debug NSB Prox on Baremetal?
Execute the test as follows:
yardstick --debug task start ./tc_prox_baremetal_l2fwd-4.yaml
Login to Traffic Generator as
root.:cd /opt/nsb_bin/prox -f /tmp/gen_<test>-<ports>.cfg
Login to SUT as
root.:cd /opt/nsb_bin/prox -f /tmp/handle_<test>-<ports>.cfg
Now let’s examine the Generator Output. In this case the output of
gen_l2fwd-4.cfg.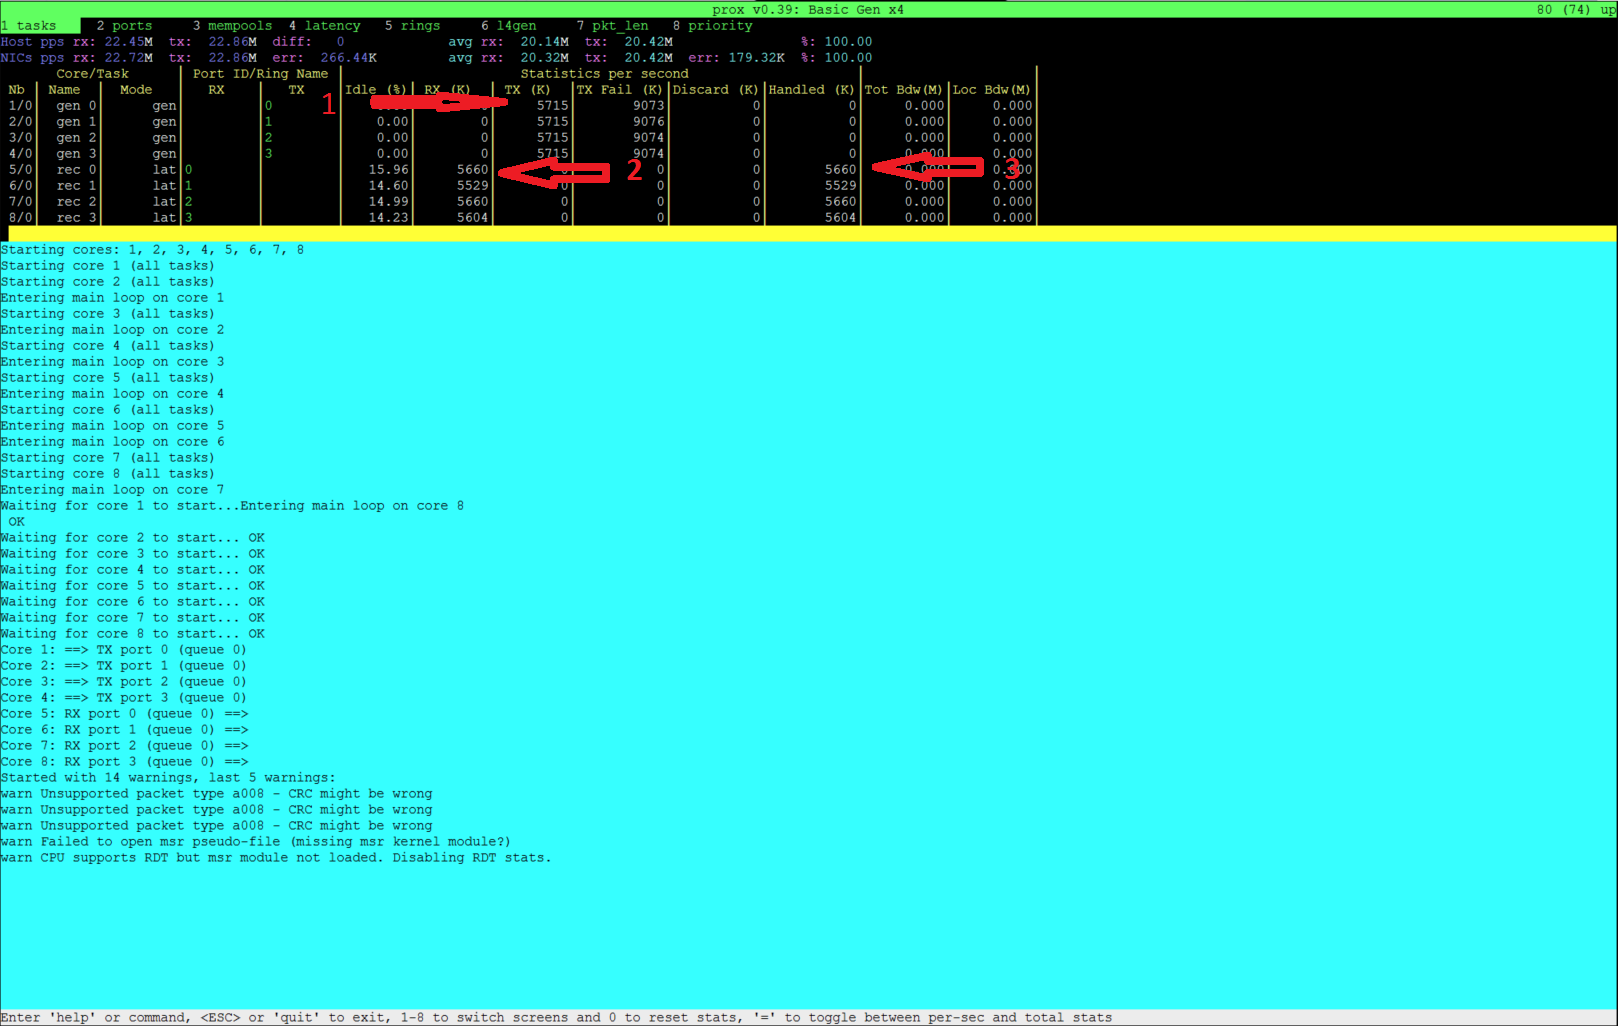
Now let’s examine the output
Indicates the amount of data successfully transmitted on Port 0
Indicates the amount of data successfully received on port 1
Indicates the amount of data successfully handled for port 1
It appears what is transmitted is received.
Caution
The number of packets MAY not exactly match because the ports are read in sequence.
Caution
What is transmitted on PORT X may not always be received on same port. Please check the Test scenario.
Now lets examine the SUT Output
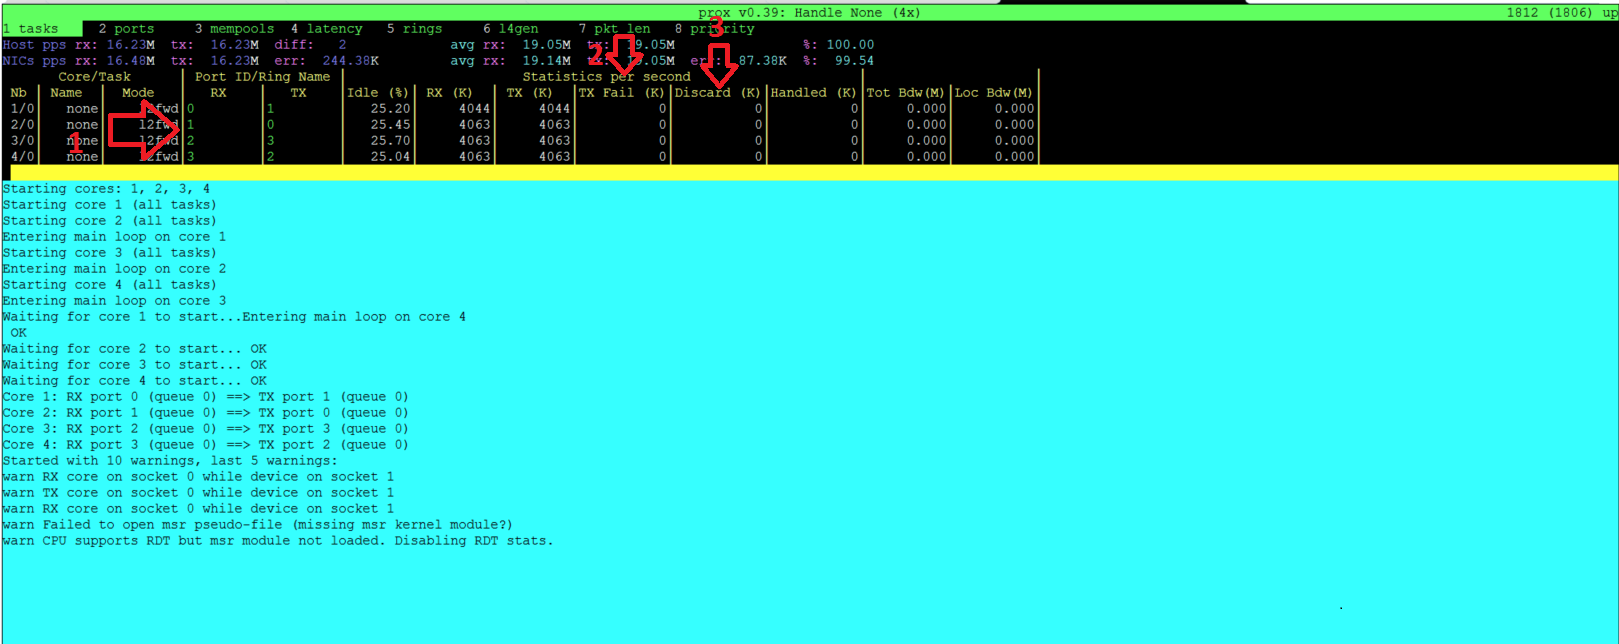
Now lets examine the output
What is received on 0 is transmitted on 1, received on 1 transmitted on 0, received on 2 transmitted on 3 and received on 3 transmitted on 2.
No packets are Failed.
No packets are discarded.
We can also dump the packets being received or transmitted via the following commands.
dump                   Arguments: <core id> <task id> <nb packets>
                       Create a hex dump of <nb_packets> from <task_id> on <core_id> showing how
                       packets have changed between RX and TX.
dump_rx                Arguments: <core id> <task id> <nb packets>
                       Create a hex dump of <nb_packets> from <task_id> on <core_id> at RX
dump_tx                Arguments: <core id> <task id> <nb packets>
                       Create a hex dump of <nb_packets> from <task_id> on <core_id> at TX
eg.:
dump_tx 1 0 1
3.14.3. NSB Prox works on Baremetal but not in Openstack. How do I resolve this?
NSB Prox on Baremetal is a lot more forgiving than NSB Prox on Openstack. A badly formed packed may still work with PROX on Baremetal. However on Openstack the packet must be correct and all fields of the header correct. E.g. A packet with an invalid Protocol ID would still work in Baremetal but this packet would be rejected by openstack.
Check the validity of the packet.
Use a known good packet in your test
If using
Randomfields in the traffic generator, disable them and retry.
3.14.4. How do I debug NSB Prox on Openstack?
Execute the test as follows:
yardstick --debug task start --keep-deploy ./tc_prox_heat_context_l2fwd-4.yaml
Access docker image if required via:
docker exec -it yardstick /bin/bash
Install openstack credentials.
Depending on your openstack deployment, the location of these credentials may vary. On this platform I do this via:
scp root@10.237.222.55:/etc/kolla/admin-openrc.sh .
source ./admin-openrc.sh
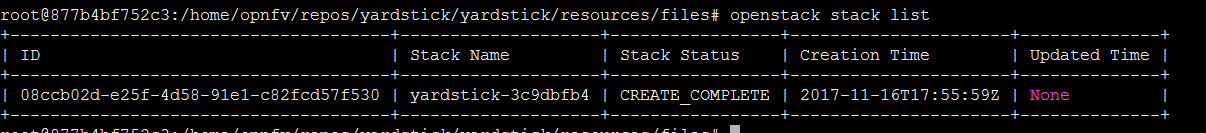
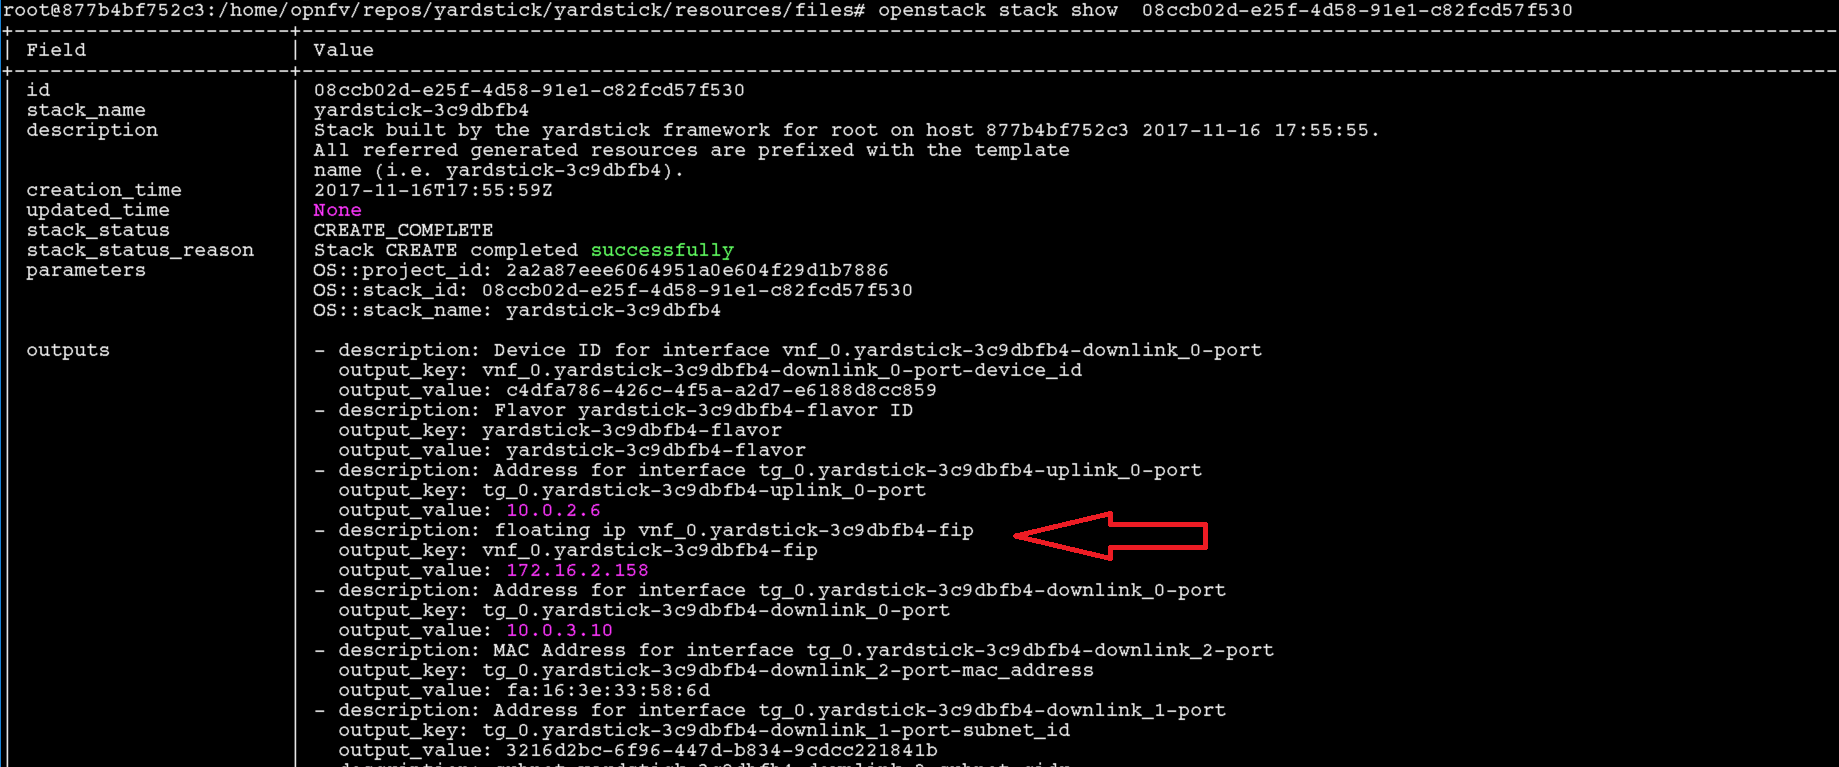
List Stack details
Get the name of the Stack.
Get the Floating IP of the Traffic Generator & SUT
This generates a lot of information. Please note the floating IP of the VNF and the Traffic Generator.
From here you can see the floating IP Address of the SUT / VNF
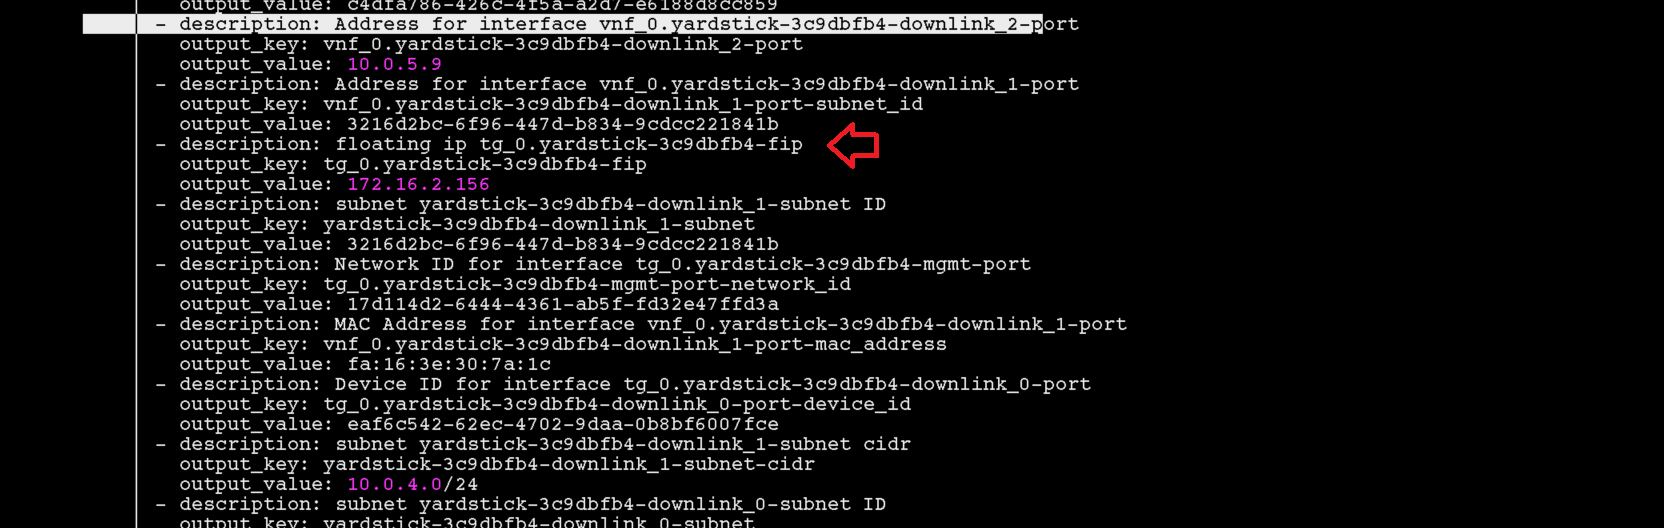
From here you can see the floating IP Address of the Traffic Generator
Get ssh identity file
In the docker container locate the identity file.:
cd /home/opnfv/repos/yardstick/yardstick/resources/files
ls -lt
Login to SUT as
Ubuntu.:ssh -i ./yardstick_key-01029d1d ubuntu@172.16.2.158
Change to root:
 sudo su

Now continue as baremetal.
Login to SUT as
Ubuntu.:ssh -i ./yardstick_key-01029d1d ubuntu@172.16.2.156
Change to root:
 sudo su

Now continue as baremetal.
3.14.5. How do I resolve “Quota exceeded for resources”
This usually occurs due to 2 reasons when executing an openstack test.
One or more stacks already exists and are consuming all resources. To resolve
openstack stack list
Response:
+--------------------------------------+--------------------+-----------------+----------------------+--------------+
| ID                                   | Stack Name         | Stack Status    | Creation Time        | Updated Time |
+--------------------------------------+--------------------+-----------------+----------------------+--------------+
| acb559d7-f575-4266-a2d4-67290b556f15 | yardstick-e05ba5a4 | CREATE_COMPLETE | 2017-12-06T15:00:05Z | None         |
| 7edf21ce-8824-4c86-8edb-f7e23801a01b | yardstick-08bda9e3 | CREATE_COMPLETE | 2017-12-06T14:56:43Z | None         |
+--------------------------------------+--------------------+-----------------+----------------------+--------------+
In this case 2 stacks already exist.
To remove stack:
openstack stack delete yardstick-08bda9e3
Are you sure you want to delete this stack(s) [y/N]? y
The openstack configuration quotas are too small.
The solution is to increase the quota. Use below to query existing quotas:
openstack quota show
And to set quota:
openstack quota set <resource>
3.14.6. Openstack CLI fails or hangs. How do I resolve this?
If it fails due to
Missing value auth-url required for auth plugin password
Check your shell environment for Openstack variables. One of them should contain the authentication URL
OS_AUTH_URL=``https://192.168.72.41:5000/v3``
Or similar. Ensure that openstack configurations are exported.
cat /etc/kolla/admin-openrc.sh
Result
export OS_PROJECT_DOMAIN_NAME=default
export OS_USER_DOMAIN_NAME=default
export OS_PROJECT_NAME=admin
export OS_TENANT_NAME=admin
export OS_USERNAME=admin
export OS_PASSWORD=BwwSEZqmUJA676klr9wa052PFjNkz99tOccS9sTc
export OS_AUTH_URL=http://193.168.72.41:35357/v3
export OS_INTERFACE=internal
export OS_IDENTITY_API_VERSION=3
export EXTERNAL_NETWORK=yardstick-public
and visible.
If the Openstack CLI appears to hang, then verify the proxys and no_proxy
are set correctly. They should be similar to
FTP_PROXY="http://<your_proxy>:<port>/"
HTTPS_PROXY="http://<your_proxy>:<port>/"
HTTP_PROXY="http://<your_proxy>:<port>/"
NO_PROXY="localhost,127.0.0.1,10.237.222.55,10.237.223.80,10.237.222.134,.ir.intel.com"
ftp_proxy="http://<your_proxy>:<port>/"
http_proxy="http://<your_proxy>:<port>/"
https_proxy="http://<your_proxy>:<port>/"
no_proxy="localhost,127.0.0.1,10.237.222.55,10.237.223.80,10.237.222.134,.ir.intel.com"
Where
10.237.222.55 = IP Address of deployment node
10.237.223.80 = IP Address of Controller node
10.237.222.134 = IP Address of Compute Node
3.14.7. How to Understand the Grafana output?
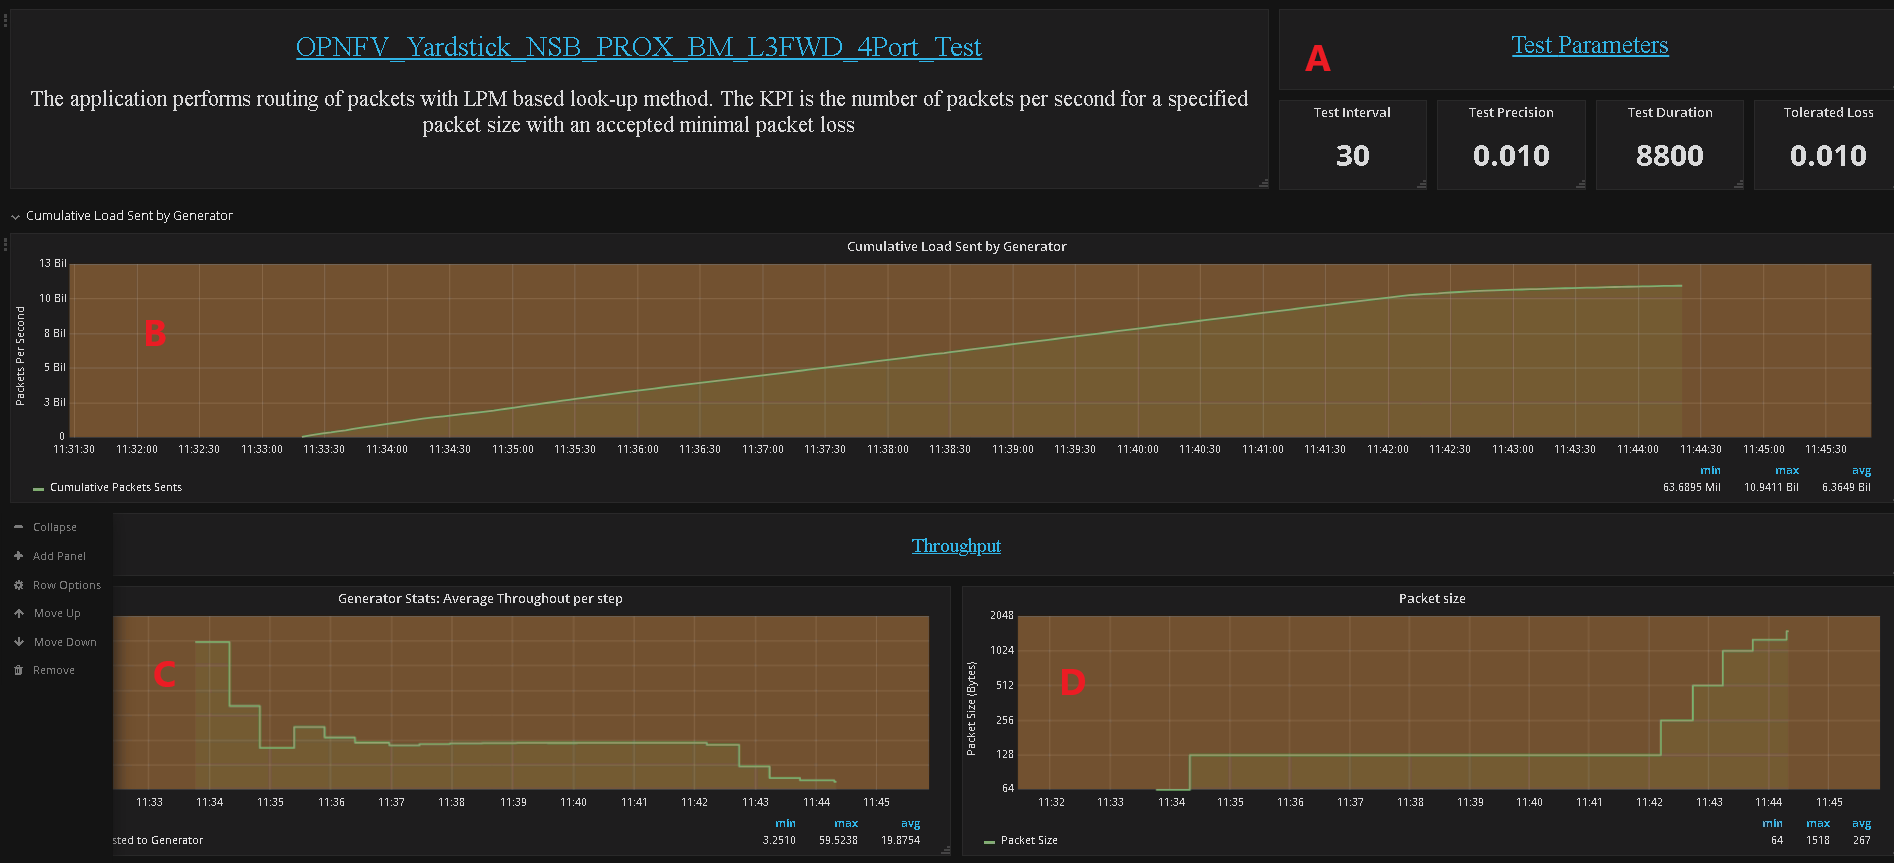
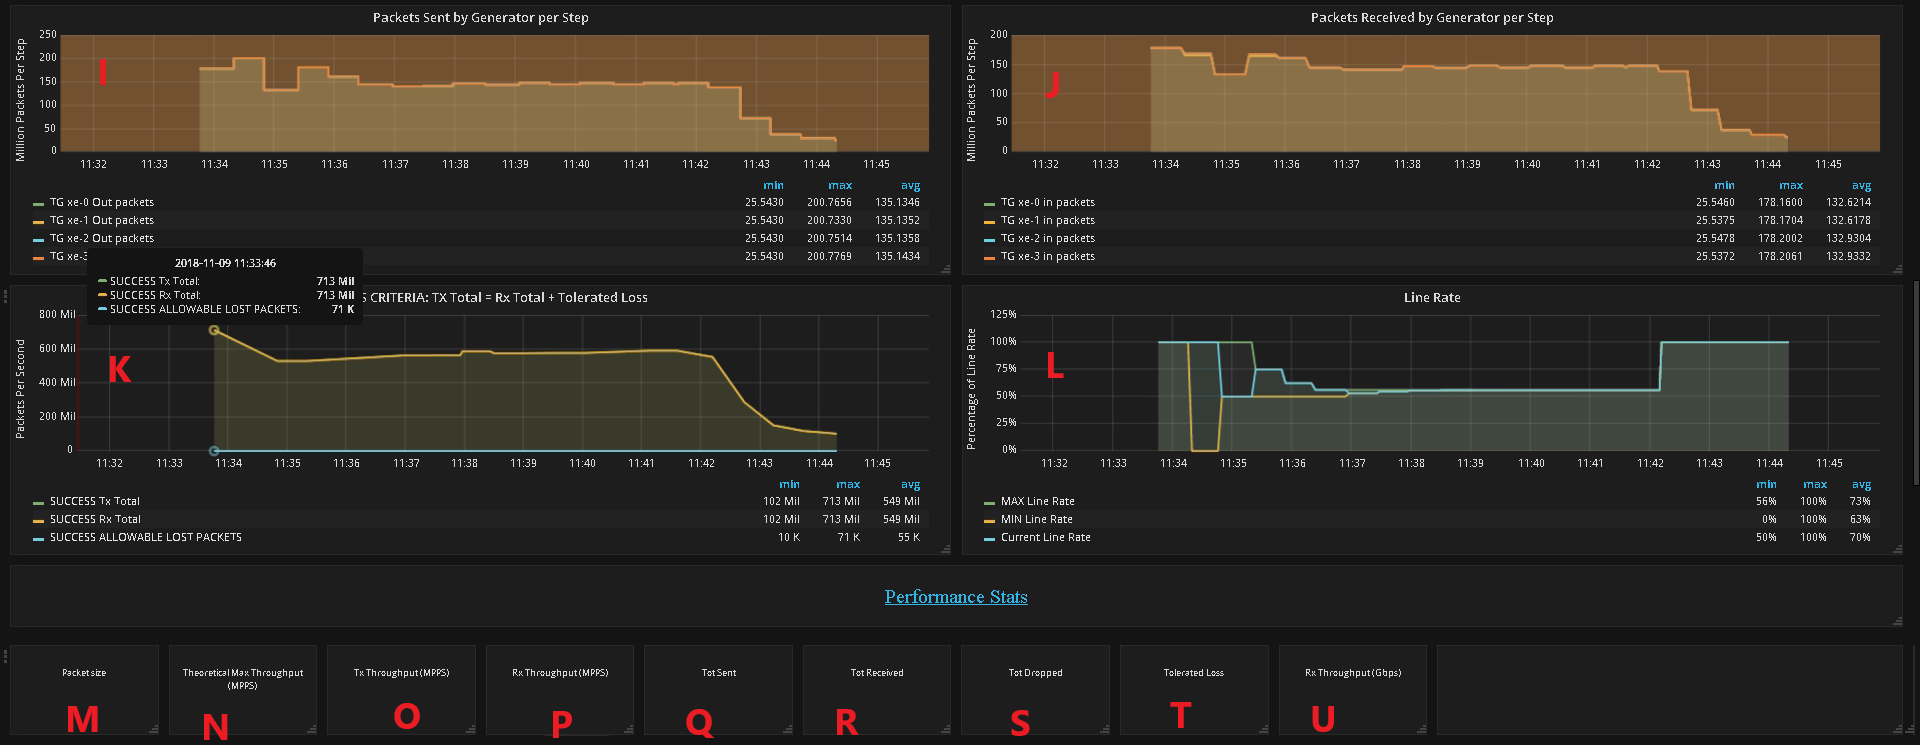

Test Parameters - Test interval, Duration, Tolerated Loss and Test Precision
No. of packets send and received during test
Generator Stats - Average Throughput per step (Step Duration is specified by “Duration” field in A above)
Packet size
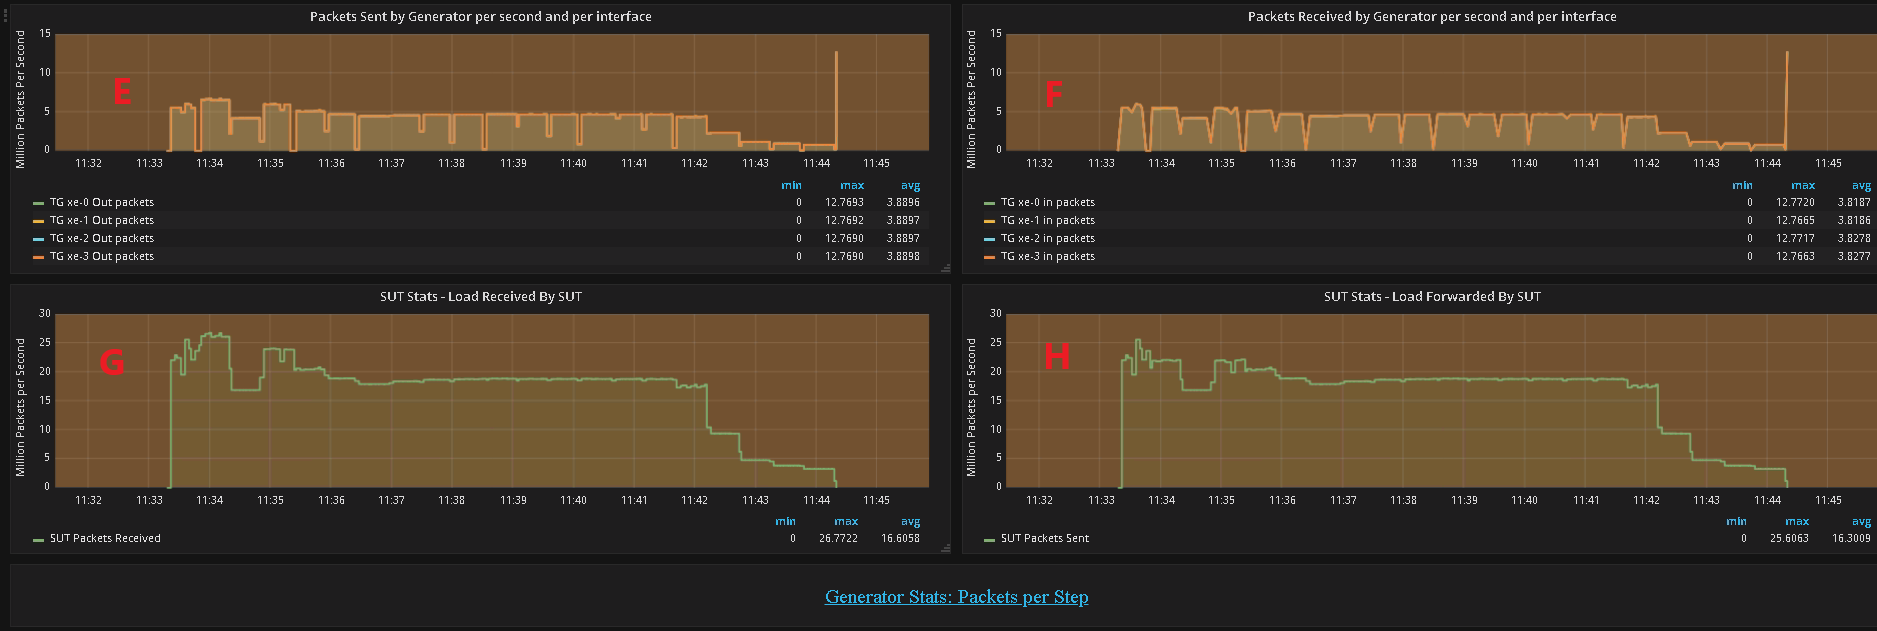
No. of packets sent by the generator per second per interface in millions of packets per second.
No. of packets recieved by the generator per second per interface in millions of packets per second.
No. of packets received by the SUT from the generator in millions of packets per second.
No. of packets sent by the the SUT to the generator in millions of packets per second.
No. of packets sent by the Generator to the SUT per step per interface in millions of packets per second.
No. of packets received by the Generator from the SUT per step per interface in millions of packets per second.
No. of packets sent and received by the generator and lost by the SUT that meet the success criteria
The change in the Percentage of Line Rate used over a test, The MAX and the MIN should converge to within the interval specified as the
test-precision.Packet size supported during test. If N/A appears in any field the result has not been decided.
The Theretical Maximum no. of packets per second that can be sent for this packet size.
No. of packets sent by the generator in MPPS
No. of packets received by the generator in MPPS
No. of packets sent by SUT.
No. of packets received by the SUT
Total no. of dropped packets – Packets sent but not received back by the generator, these may be dropped by the SUT or the generator.
The tolerated no. of dropped packets.
Test throughput in Gbps
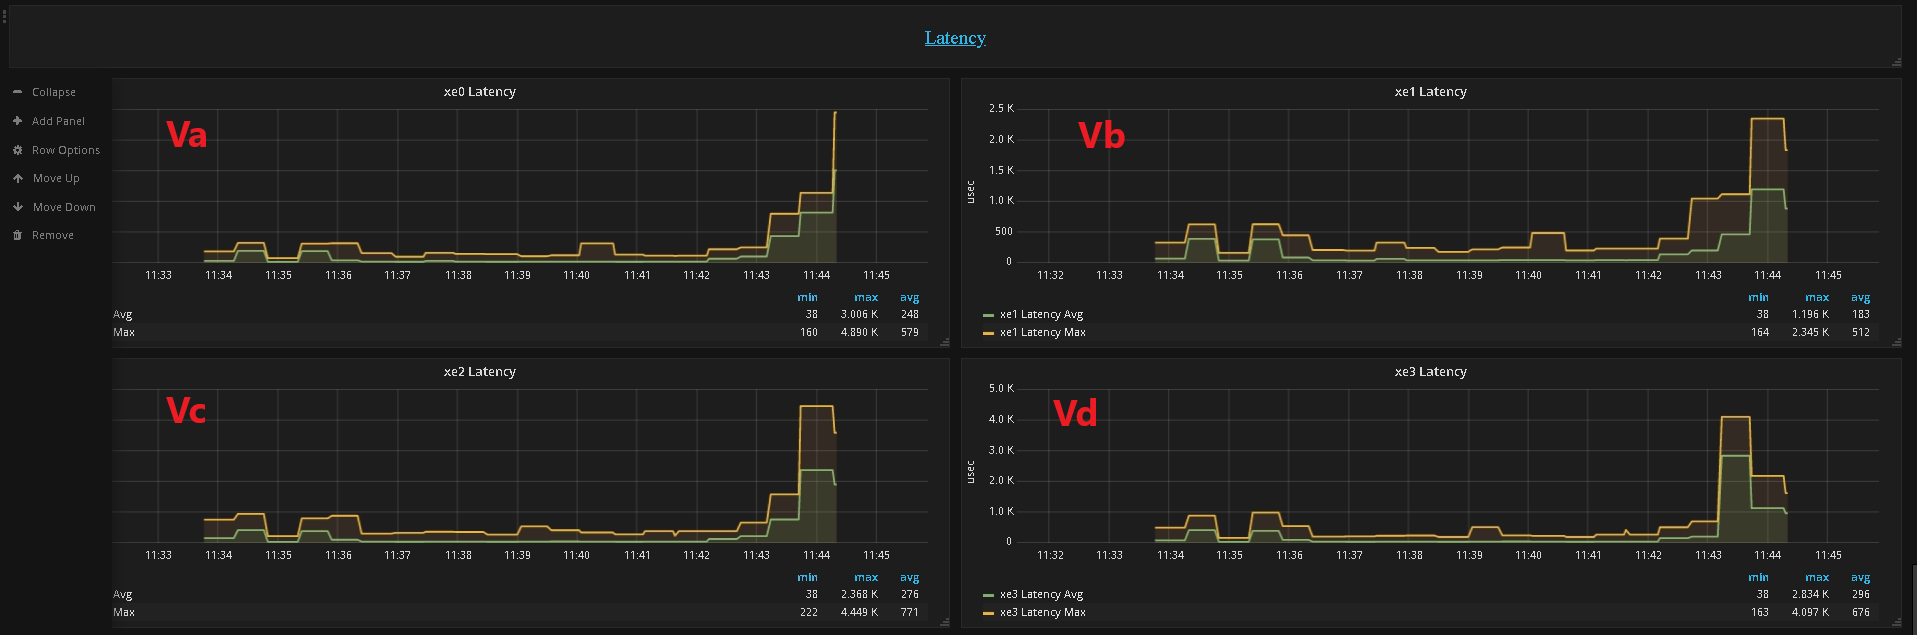
- Latencey per Port
Va - Port XE0
Vb - Port XE1
Vc - Port XE0
Vd - Port XE0
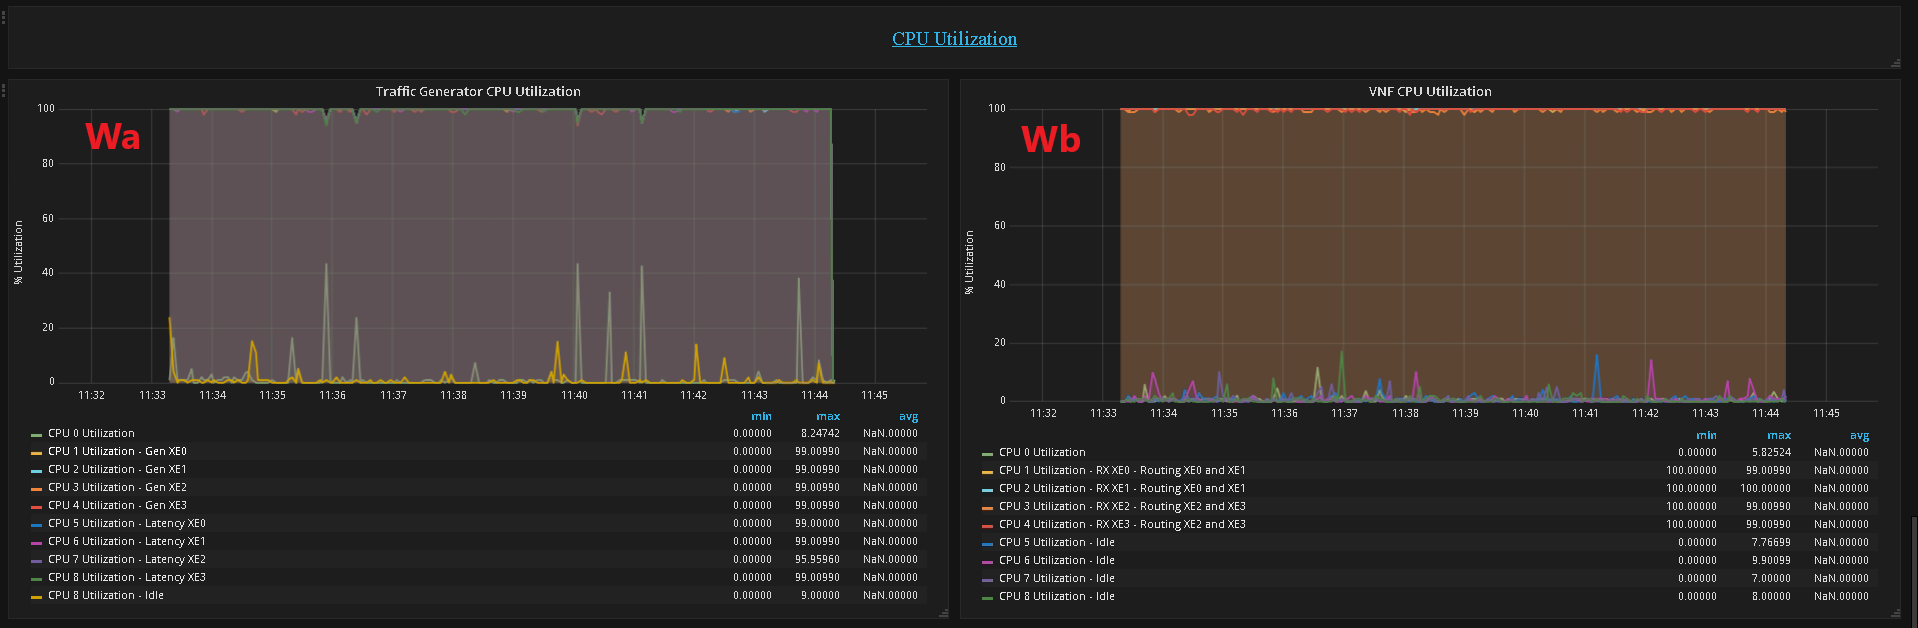
- CPU Utilization
Wa - CPU Utilization of the Generator
Wb - CPU Utilization of the SUT